
When implementing server-side tracking with Google Tag Manager (sGTM), not all events originate from the browser. Many important events—such as CRM updates, backend actions, or payment confirmations—happen on external systems.
One reliable way to send those events to your server GTM container is by using webhooks.
However, debugging webhook requests in the server container preview can be confusing because these requests do not come from a browser and therefore do not include the cookies that preview mode normally relies on.
In this guide, you’ll learn how to debug incoming webhooks in Google Tag Manager server preview, step by step.
Step 1: Understand how webhooks work in server-side tracking
Before debugging webhooks, it’s important to understand how they work.
A webhook allows one application to send event data to another application automatically when something happens.
Instead of the server container receiving data from browser scripts, external systems can send an HTTP request directly to your tagging server endpoint.
For example, a webhook can be triggered when:
- a payment is completed
- a new lead is created in a CRM
- a purchase is confirmed in a backend system
The receiving endpoint for these events is your server tagging URL.
Step 2: Create or access your server GTM container
To start debugging webhook requests, you first need a Google Tag Manager server container.
If you haven’t created one yet:
- Create a Server container in Google Tag Manager.
- Deploy it using a server hosting provider such as Stape.
- Note the Tagging Server URL, which will receive incoming webhook requests.
This URL will be used as the destination when configuring your webhook.
Example:
https://sgtm.yourdomain.com
Step 3: Open server preview mode
Next, open Preview mode in your server container.
Inside the preview interface:
- Click the three-dot menu in the top right corner.
- Select Send requests manually.
- Copy the X-Gtm-Server-Preview HTTP header.
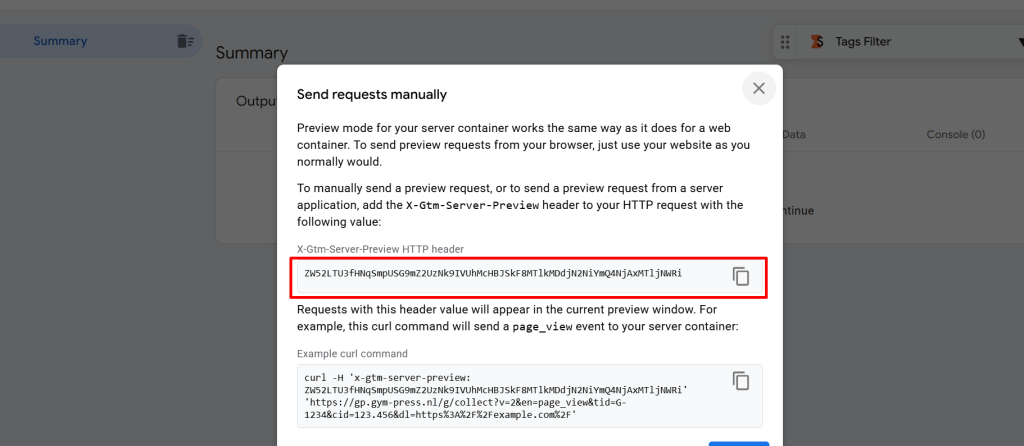
This header allows external HTTP requests to appear inside the preview debugger.
Without this header, webhook requests will not show up in the preview environment.
Step 4: Add the preview header in your hosting environment
Because webhook requests come from external systems, they do not contain the preview cookies that GTM normally uses.
To connect these requests with your preview session, you must include the X-Gtm-Server-Preview header.
If you are using Stape to host your server container, you can configure this header inside your container settings.
Typical steps include:
- Open your container in the Stape dashboard.
- Go to container settings.
- Find the Preview Header configuration option.
- Paste the X-Gtm-Server-Preview header you copied earlier.
- Save the configuration.
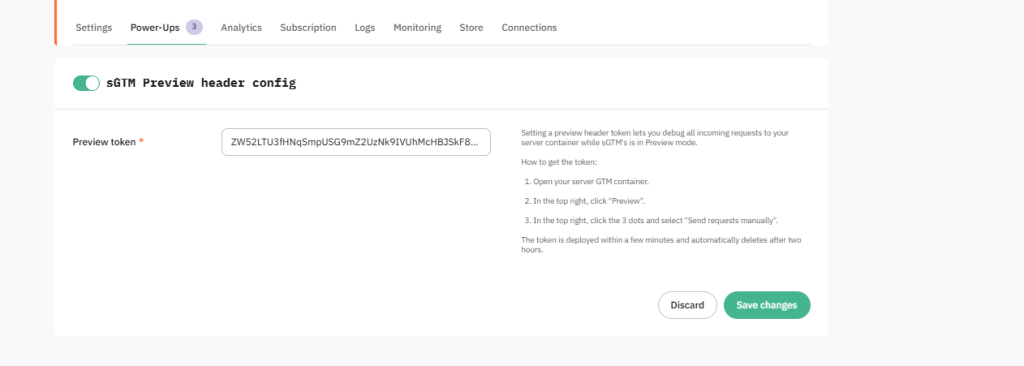
Once added, incoming webhook requests will appear in the preview debugger.
Important:
The preview header value may expire or change over time. Always use the latest value when debugging.
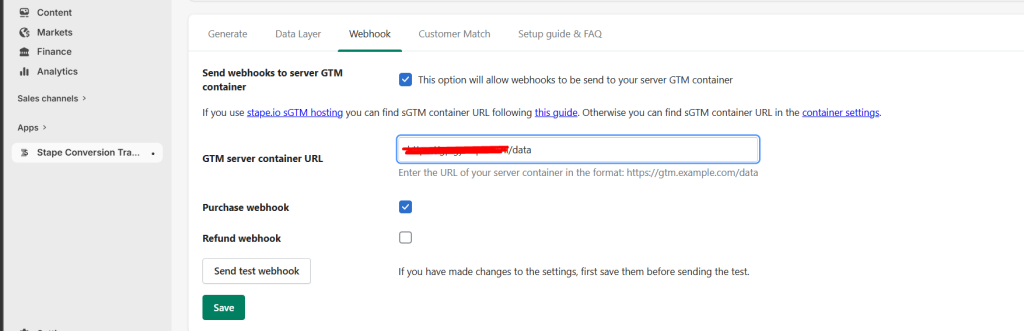
Step 5: Create the webhook endpoint
Now configure the webhook in the system that will send event data.
The webhook URL should include:
- your server tagging URL
- a request path that identifies the webhook
Example webhook URL:
https://sgtm.yourdomain.com/data
This path helps the server container identify which requests belong to the webhook.
Step 6: Set up a client to process webhook requests
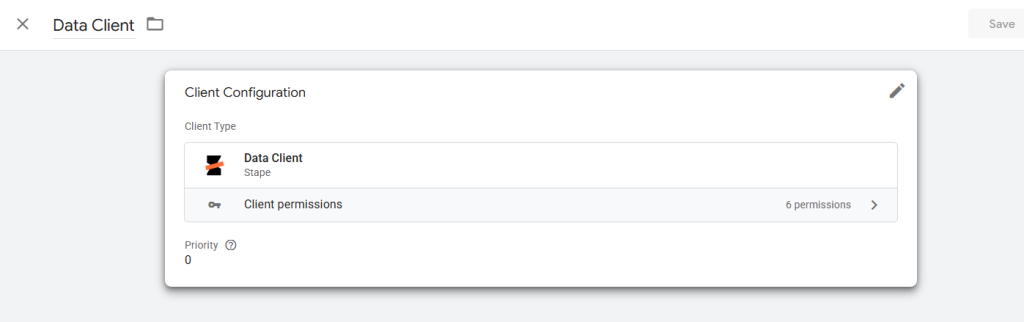
In server-side GTM, clients are responsible for receiving and processing incoming requests.
To process webhook data, you can use a Data Client template (Made by Stape)
To set it up:
- Import the Data Client template into your server container.
- Create a new client using this template.
- Configure the client to listen for the webhook request path.
Example:
/webhooks
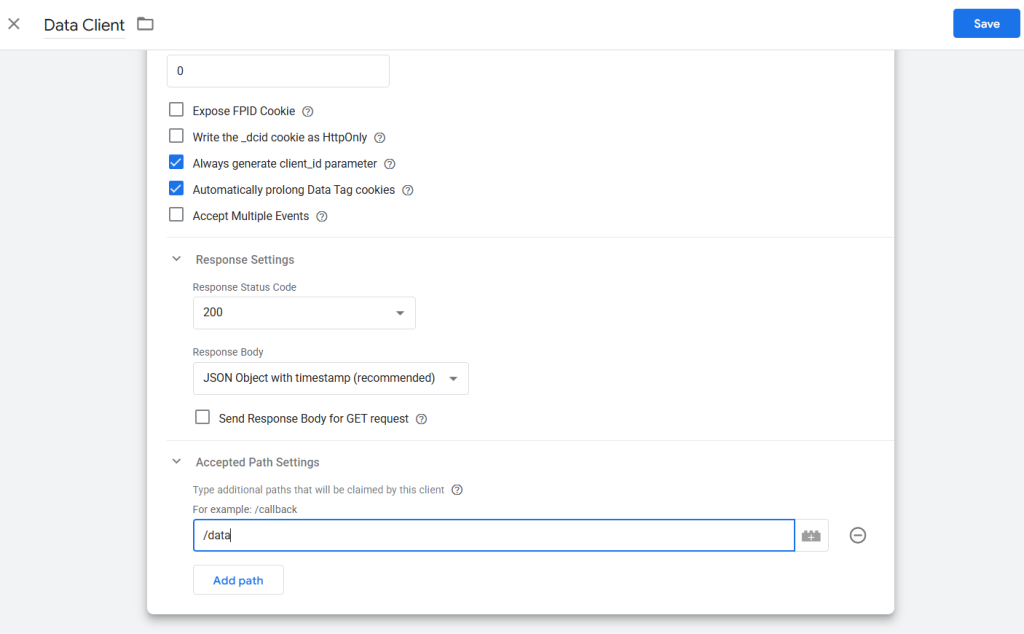
When the webhook request arrives, the Data Client will claim the request and convert the payload into event data that GTM can use.
Step 7: Trigger a webhook event
After configuring the webhook endpoint and client, trigger the event that should send the webhook.
For example:
- create a test order
- generate a test payment event
Once the event occurs, the system should send an HTTP request to your tagging server endpoint.
Step 8: Inspect the webhook request in preview mode
Return to the server GTM preview interface.
If everything is configured correctly, you should see:
- an Incoming HTTP Request event
- the request path that matches your webhook endpoint
- the client claiming the request
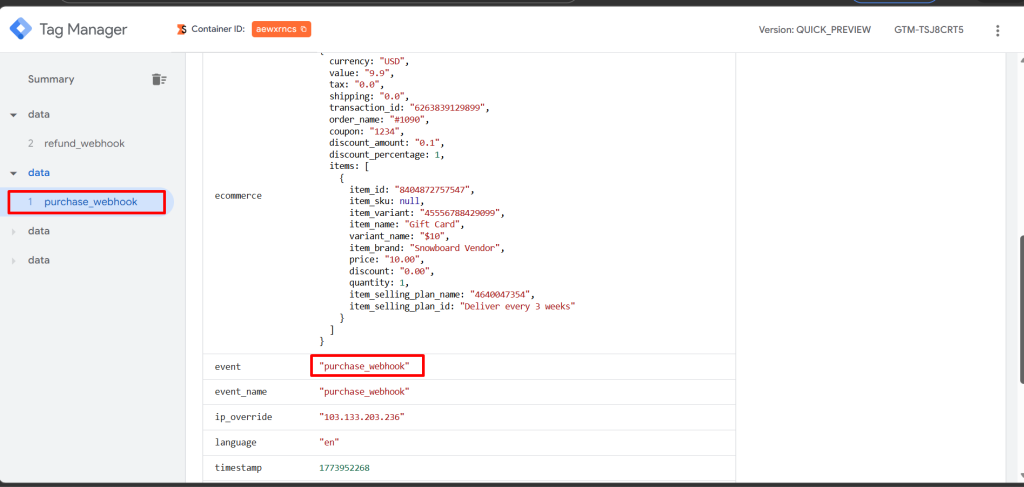
You can click on the request to inspect the payload and view all the data sent by the webhook.
This data becomes available as event data inside the server container and can be used by tags.
Step 9: Remove the preview header after testing
Once debugging is complete, remove the preview header configuration from your hosting platform.
This step is important because preview headers are meant only for debugging sessions.
After removing the header, publish your server container to apply the production configuration.
Conclusion
Webhooks are a powerful way to send event data directly to your server-side Google Tag Manager container, especially when events originate from backend systems like CRMs, payment processors, or internal databases.
However, debugging these requests requires a slightly different approach because webhook calls do not include the preview cookies used by GTM.
By using the X-Gtm-Server-Preview HTTP header, you can link external webhook requests with the server container preview and inspect them in real time.
Once this setup is in place, debugging webhook integrations becomes much easier, helping ensure your server-side tracking implementation captures and processes events correctly.