
Traffic from AI-powered tools such as ChatGPT, Gemini, Claude, or Perplexity is usually classified as generic referral traffic in Google Analytics 4. While technically correct, this setup makes it difficult to understand how these platforms actually contribute to website discovery and engagement.
As AI tools increasingly influence how users find and interact with content, treating them as a distinct traffic source can unlock more meaningful insights. In this guide, you’ll learn how to identify, organize, and analyze AI-driven traffic in GA4 so your reports better reflect real user behavior.
Create a custom channel group for AI tools
By default, visits from AI platforms are grouped under Referral in GA4. This works from a technical standpoint, but it’s not ideal when you want a quick and reliable view of how much traffic AI tools are generating.
It’s also worth noting that AI attribution will never be perfect. Some tools don’t consistently pass referrer information, meaning GA4 can only capture part of the picture. Even so, organizing the data you can track makes your analysis far more actionable.
Why custom channel groups work best
You could rely on report-level filters or build ad-hoc custom reports, but GA4’s filter character limits quickly become a bottleneck when dealing with dozens of AI platforms. Custom channel groups are more flexible and easier to maintain over time.
How to set it up
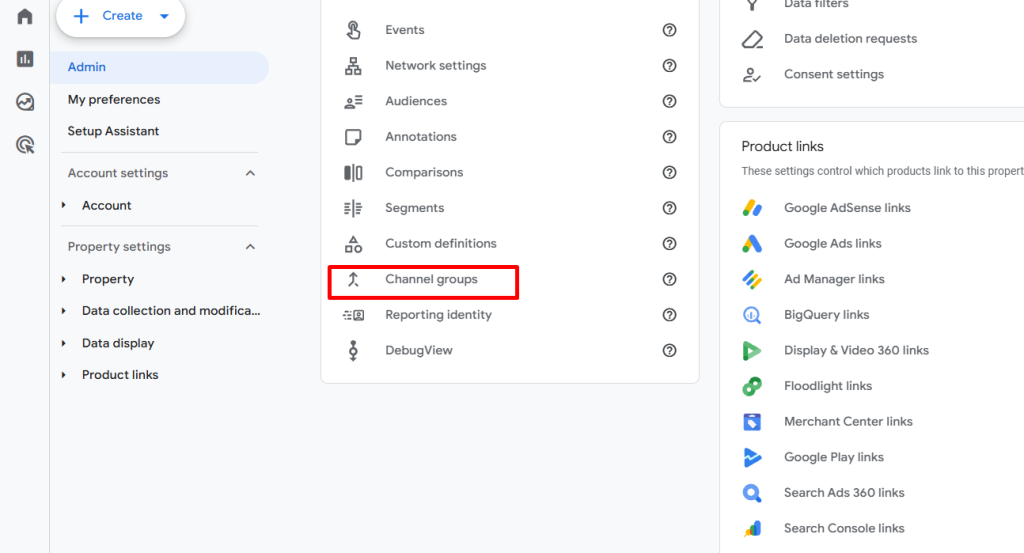
- Go to Admin → Data display → Channel groups
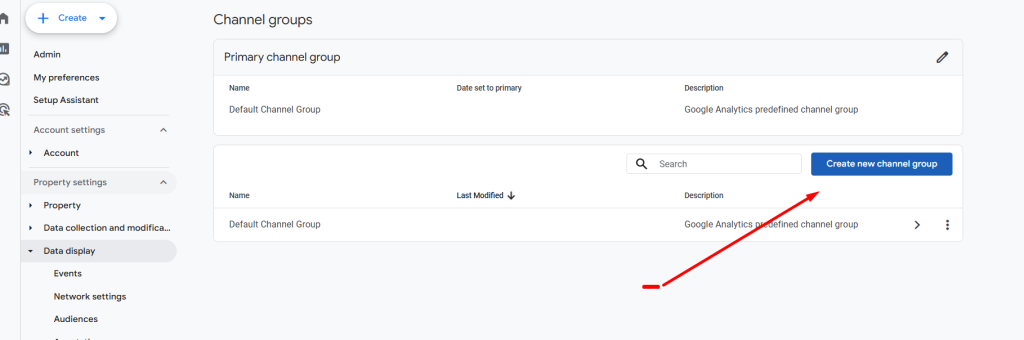
- Create a new channel group
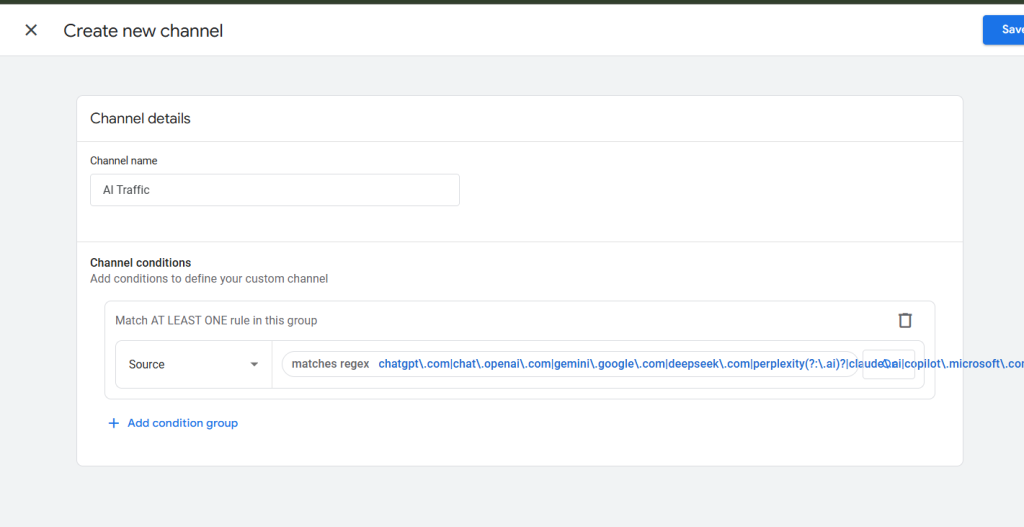
- Add a new channel and name it Artificial Intelligence
(Using the full name instead of “AI” helps with filtering and clarity later.)
For the channel condition:
- Dimension: Session source
- Operator: matches regex
- Value: paste your full AI-domain regex
After saving, make sure the AI Traffic channel appears above Referral in the channel order. GA4 processes channels top-down, so placement matters.
View AI traffic in standard GA4 reports
Once the channel group is active, open the Traffic acquisition report. If you don’t see acquisition reports in your property, you may need to publish the Life cycle collection from the Library.
In the report table, change the primary dimension to Session custom channel group. You’ll now see AI traffic broken out as its own channel, alongside Search, Social, Referral, and others.
This view is great for high-level comparisons, but if you want to focus entirely on AI-driven sessions, a dedicated report is the next step.
Create a dedicated AI traffic report
To build a focused view:
- Open the Traffic acquisition report
- Click Customize report
- Add a filter where:
Session custom channel group exactly matches AI Traffic
Using the channel group here avoids the source-regex character limits you’d otherwise hit.
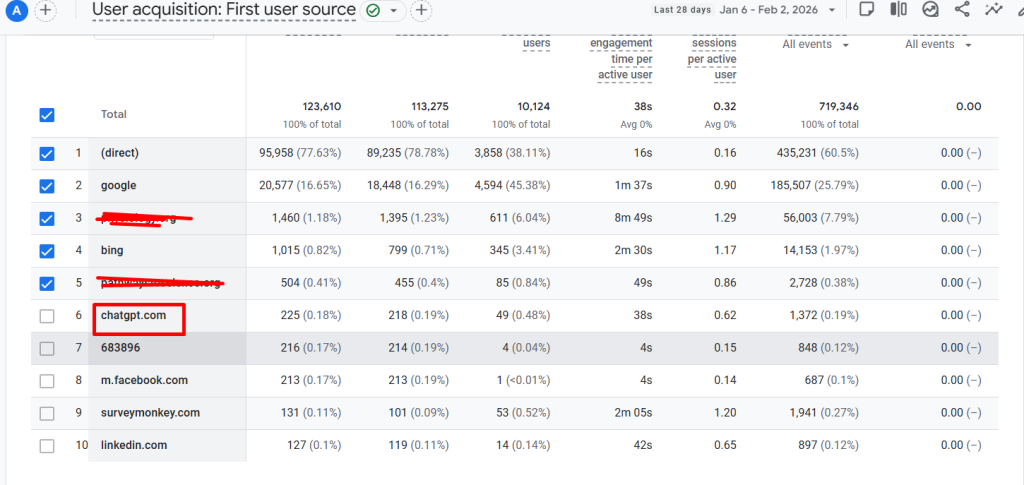
Next, set Session source as the primary dimension so you can quickly see which AI platforms are driving traffic.
You can further tailor the report by adjusting metrics, charts, or layout. When finished, save it as a new report—something like AI Traffic works well.
To make it easy to find later, add the report to an existing collection (for example, under Acquisition in the Life cycle collection).
Dive deeper with Explorations
For deeper analysis, you can open your AI traffic report as an Exploration. This lets you:
- Compare engagement metrics across AI tools
- Analyze landing pages driven by AI traffic
- Study conversion behavior and paths
Each element of the report becomes its own tab in the Exploration, which you can modify, duplicate, or remove as needed.
Final words
AI tools are rapidly becoming a meaningful discovery channel. Leaving that traffic buried inside generic referral data makes it harder to understand what’s really driving growth.
Whether you choose a simple filter, a custom channel group, or a full reporting workflow depends on how deeply you want to analyze the data—but separating AI traffic is quickly becoming a best practice.
If you’re tracking AI traffic in a different way, sharing those approaches can help push this conversation forward.