
When analyzing data in Google Analytics 4, looking at numbers alone doesn’t always tell the full story. A traffic count of 10,000 users or a conversion rate of 3% may sound good—but is it better or worse than before?
That’s where comparison date ranges become useful. Comparing one period against another helps you quickly understand trends, growth, drops, and overall performance changes.
Whether you want to compare:
- This month vs last month
- This week vs last week
- Or this year vs last year
GA4 makes it fairly simple once you know where to look.
Why Use Comparison Date Ranges?
Date comparisons help answer questions like:
- Is traffic increasing or decreasing?
- Did conversions improve after a campaign launch?
- Are revenue drops seasonal?
- How does this month compare to the same period last year?
Instead of looking at isolated numbers, comparisons give context to your data.
How to Add Comparison Date Ranges in GA4 Reports
This is the easiest and most commonly used method.
Step 1: Open Any GA4 Report
Go to: Reports
Open any standard report like:
- Traffic Acquisition
- Engagement
- Monetization
- Landing Pages
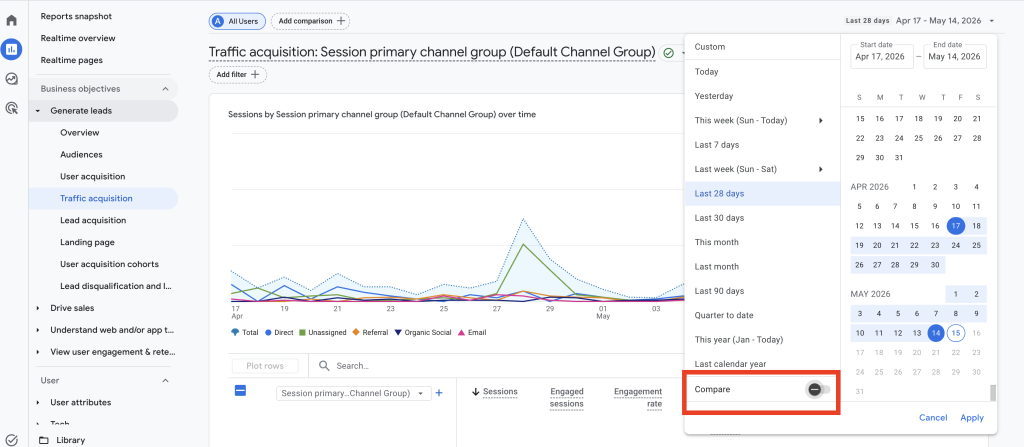
Step 2: Click the Date Selector
In the top-right corner of the report, click the current date range.
For example:
- Last 28 days
- Last 30 days
- Custom range
This opens the date settings panel.
Step 3: Enable “Compare”
Inside the date panel:
- Turn ON the “Compare” option
You’ll now see comparison choices.
Step 4: Choose the Comparison Type
GA4 gives multiple options, including:
- Previous period
- Previous year
- Custom period
Example:
Compare:
- Jan 1 – Jan 31 vs Dec 1 – Dec 31
Or:
Compare:
- April 2026vs April 2025
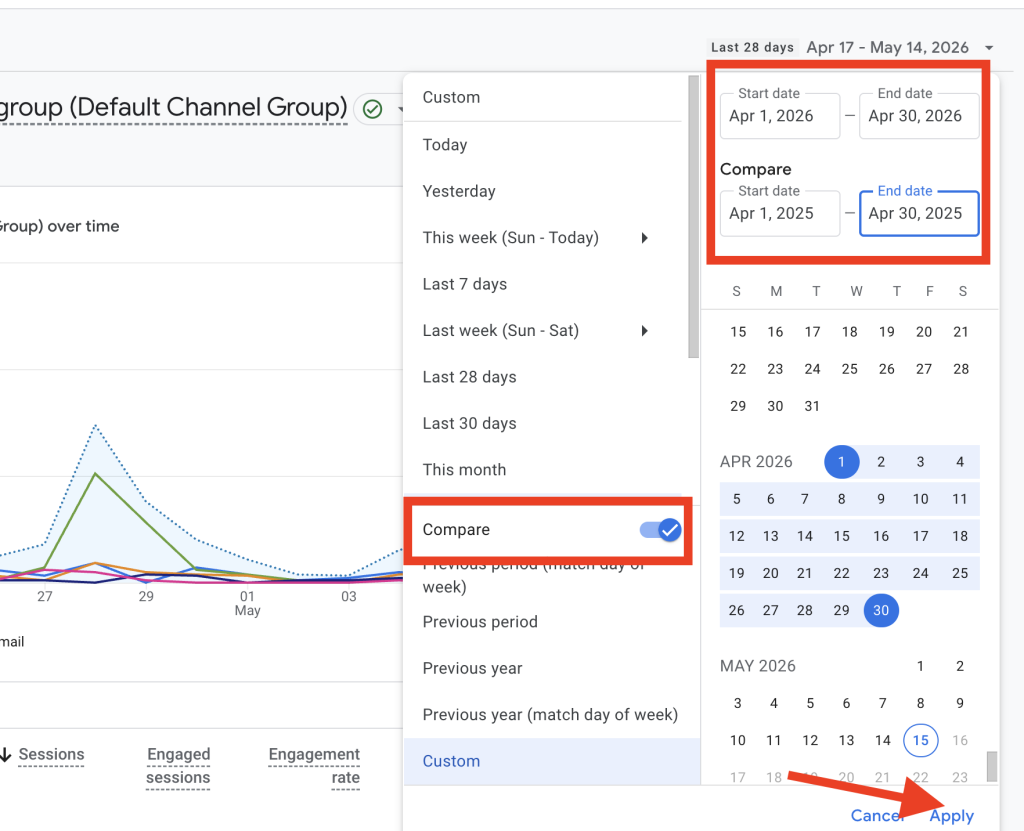
Step 5: Apply the Comparison
Click Apply.
GA4 will now display:
- Percentage increase/decrease
- Trend indicators
- Side-by-side comparison values
You’ll notice green and red percentage changes appearing across metrics.
Best Practices for Date Comparisons
1. Compare Similar Time Periods
Avoid comparing:
- 7 days vs 30 days
Instead compare:
- 30 days vs previous 30 days
This keeps the analysis fair.
2. Consider Seasonality
Some businesses naturally fluctuate during certain months.
For example:
- Holiday spikes
- Off-season dips
- Event-based traffic changes
A drop is not always a problem—it may simply be seasonal behavior.
3. Don’t Focus Only on Traffic
Always compare:
- Conversions
- Revenue
- Engagement
- Purchase rate
Traffic alone doesn’t tell the full story.
Common Mistakes to Avoid
- Comparing incomplete date ranges
- Ignoring seasonal trends
- Comparing different campaign periods unfairly
- Assuming every drop is a tracking issue
Final Thoughts
Adding comparison date ranges in GA4 is one of the easiest ways to make your analysis more meaningful. Instead of just looking at numbers, you begin to understand trends, growth, and performance changes over time.
Whether you use standard reports or Explorations, date comparisons help turn raw data into actual insights—and that’s where better decision-making starts.