
What is GA4 Debug View?
Debug View in GA 4 (Google Analytics 4) is a feature that allows you to validate your GA4 implementation. In the past version of Google Analytics, Universal Analytics, you only had limited debugging functionality via Real-time report, however now in GA4, there is a full debugger within Google Analytics 4 interface.
In the debug View of GA4 you can see each and every event that is logged along with the parameter and user properties.
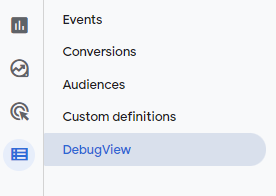
Debug View in Google Analytics 4 is available in the Configure section (menu options on the left-hand side). Click on Configure and then DebugView to go to GA4 Debug View (see the image below)
How to use the Debug View in GA4?
When you first go to GA DebugView it won't show you any data because it needs to be enabled for you to see the data in this view. There are three ways to enable this view. These ways are activates using one of the following:
- Google Analytics Debugger Chrome extension
- Google Tag Manager Preview mode
- GA4 debug_mode parameter
Google Analytics Debugger Chrome Extension
This Chrome extension loads the debug version of the Google Analytics Javascript for all sites you browse using Google Chrome.
To use this follow these steps
- Add Chrome extension from https://chrome.google.com/webstore/detail/google-analytics-debugger/jnkmfdileelhofjcijamephohjechhna?hl=en.
- After you install it turn it On by clicking on the extension in your browser bar.
- Visit your site in a new tab or window of the chrome window.
- Open GA4 BebugView in another window or tab and you will start to see all the data from your visit in the debug view.
Google Tag Manager Preview Mode
- Put GTM in preview mode
- Visit your site
- Open GA4 DebugView in another window/tab and you will start to see the data
GA4 debug_mode parameter
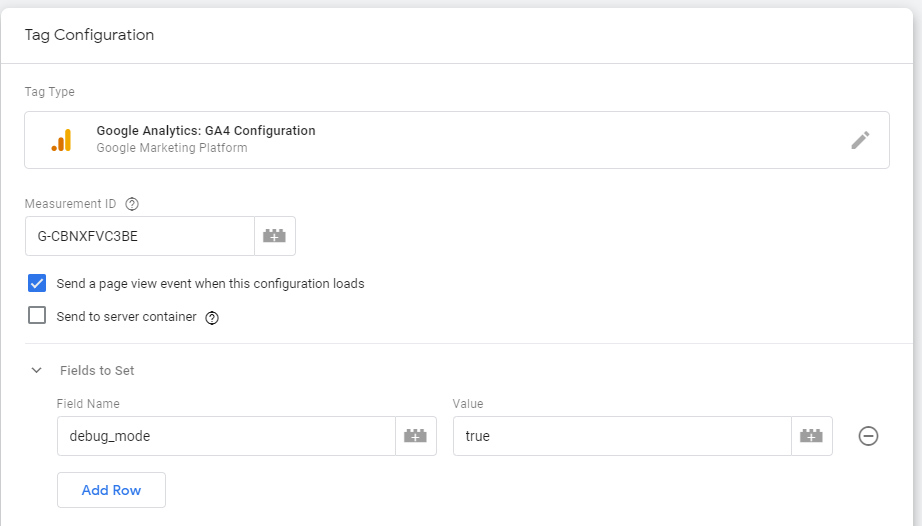
You can enable GA4 to debug view by just passing a parameter called debug_mode parameter. You can pass this parameter to either specific events that you want to see in the DebugView or by adding it to the base GA4 configuration tag to track all the events.
Below is the configuration screen that shows you how to enable this view.
Specific Events

All Events: If you use the following configuration then it wil apply to all events that use this GA4 configuration and you don't have to apply to each and every event
GA4 DebugView Interface
Once you have enabled the debug view, you will start to see the session for the browser that is in debug view (see below).
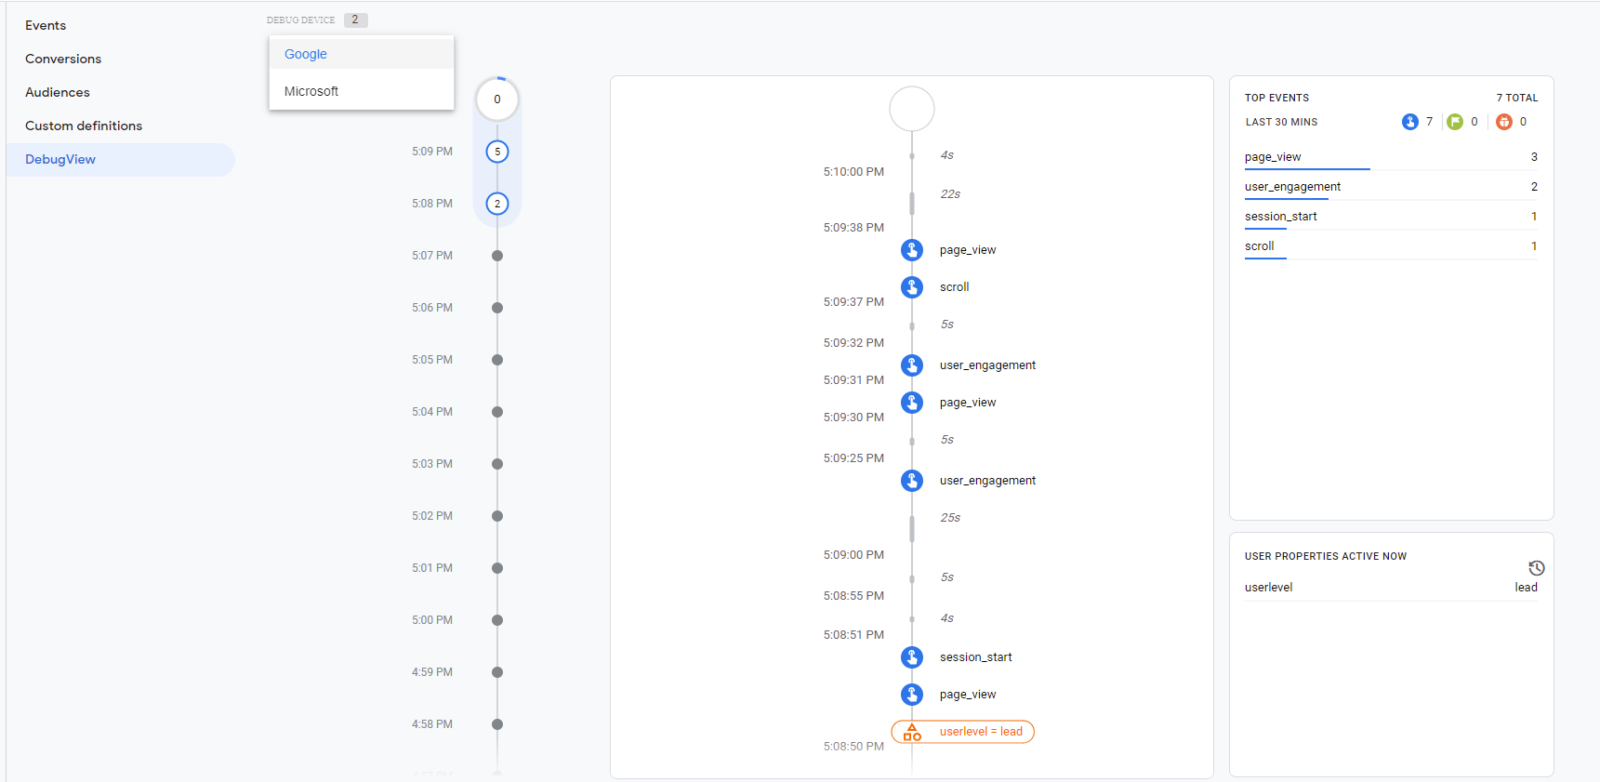
Let's look at the various sections of the above window. I will go over them one by one from left to right.
1. Debug Device
The "Debug Device" allows you to choose the specific device you want to debug. If you are only using Chrome Browser extension then you will only see Google. However, in the above view, I am using the debug_mode parameter and hence I can see multiple,e browsers that I am visiting the site from. This option lets multiple people, working on the implementation, focus on their own instrumentation without impacting one another.
2. Minutes stream
This stream shows a big circle for each of the most recent 30 minutes. Underneath each is the activity for each minute. The number in the circle shows the count of the events received in that particular minute. Clicking on one of these circles populates the "Seconds stream" (see next section) with the list of events that were logged during that minute.
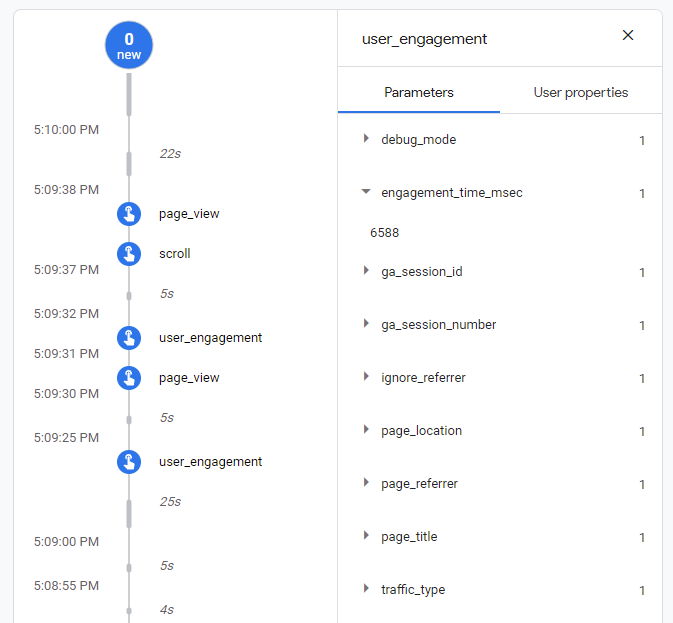
3. Seconds stream
The next section is the "Seconds stream". This shows all the events that have been logged during the last 60 seconds. Each event displays a timestamp that corresponds to the time it was logged from the device/session that was in the debug view. When you click on an event in this stream, you will see a list of all parameters for that event, and then expanding that event will show you the value of that parameter.
4. Top Events
The Top Events section shows the top events in the last 30-minute period and their count.
5. User Properties Active Now
The bottom right section shows the latest state of the set of User Properties for the session that is in the debug state.
Other Google Analytics 4 posts that might like
- GA4 Segments Explained
- GA4 Audiences: How to create, edit, archive, and use Custom Audience
- Comparisons in Google Analytics 4 (GA4)
- 35+ Things About Google Analytics 4 That Will Make You Look Like a Genius
- How to Upgrade Google Analytics to Google Analytics 4 (GA4)?
- Google Analytics 4 (GA4) - Get Answers to Common Questions
Where to get more help with Google Analytics 4?
- Get your team ready for GA4 with this online self-paced course - Google Analytics 4 Masterclass
- Workshop - We offer onsite customized workshops. Reach out to us for more details.
- Consulting - We can get you up and running with Google Analytics 4 as well as train your and your team to use it effectively. Reach out to us for more details.
- Freelancers - Join our network and get support to help your clients with Google Analytics 4 and more.