
When you build a dashboard in Looker Studio, one of the first things people want to do is change the date range. Whether it’s checking last week’s performance or comparing this month to last month, a date filter makes your dashboard flexible and easy to use.
Why a Date Filter Is Important
Without a date filter, your dashboard shows data for a fixed period. That means every time someone wants a different date range, they have to edit the report.
A date filter solves this by letting users:
- Switch between different time periods
- Analyze trends over time
- Customize the view without changing the dashboard
Step-by-Step: How to Add a Date Filter
1. Open Your Dashboard
Go to your Looker Studio report where you want to add the filter.
2. Add the Date Range Control
- Click “Add a control” in the top menu
- Select “Date range control”
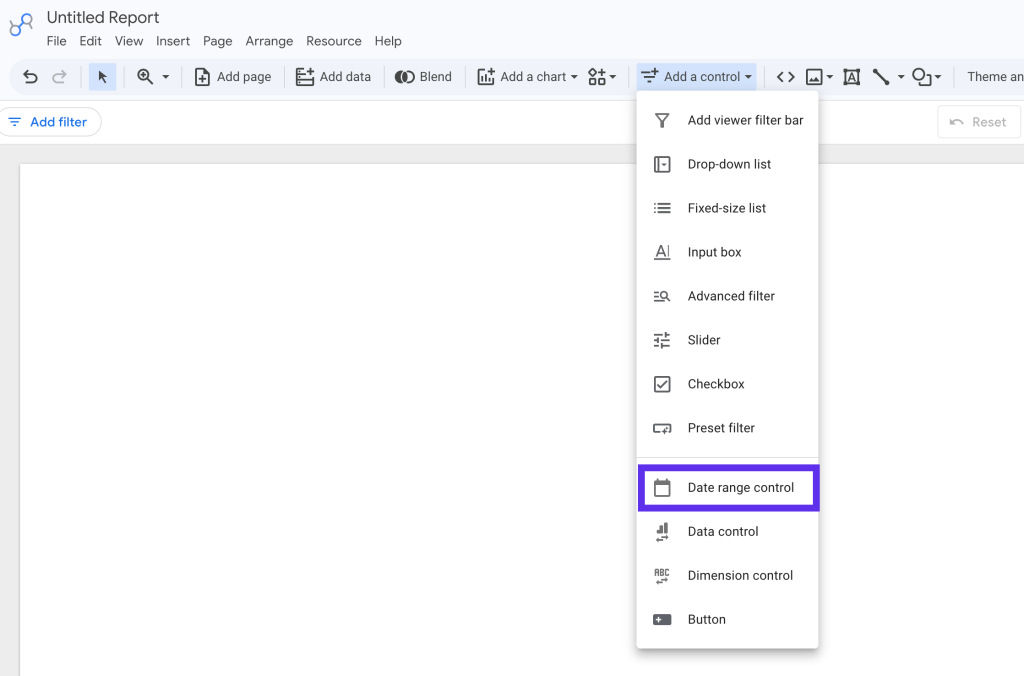
Now click anywhere on the dashboard to place it.
3. Position It Clearly
Place the date filter at the top of the dashboard so it’s easy for users to find and use.
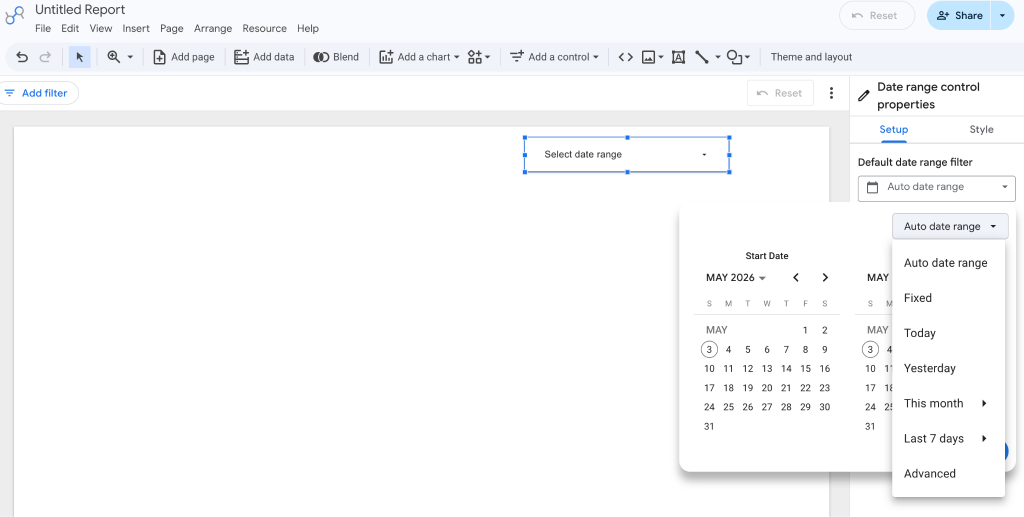
4. Set a Default Date Range
With the filter selected:
- Go to the right-hand panel
- Choose a default range like:
- Last 7 days
- Last 28 days
- Last 30 days
This is what users will see when they first open the dashboard.
How the Date Filter Works
By default, the date filter applies to all charts on the page that use the same data source. When a user changes the date, all connected charts update automatically.
How to Make the Date Filter Report-Level
If you want your date filter to control all pages in the report (not just one page), you can set it at the report level.
Steps:
- Right-click on the date filter
- Select “Make report-level”
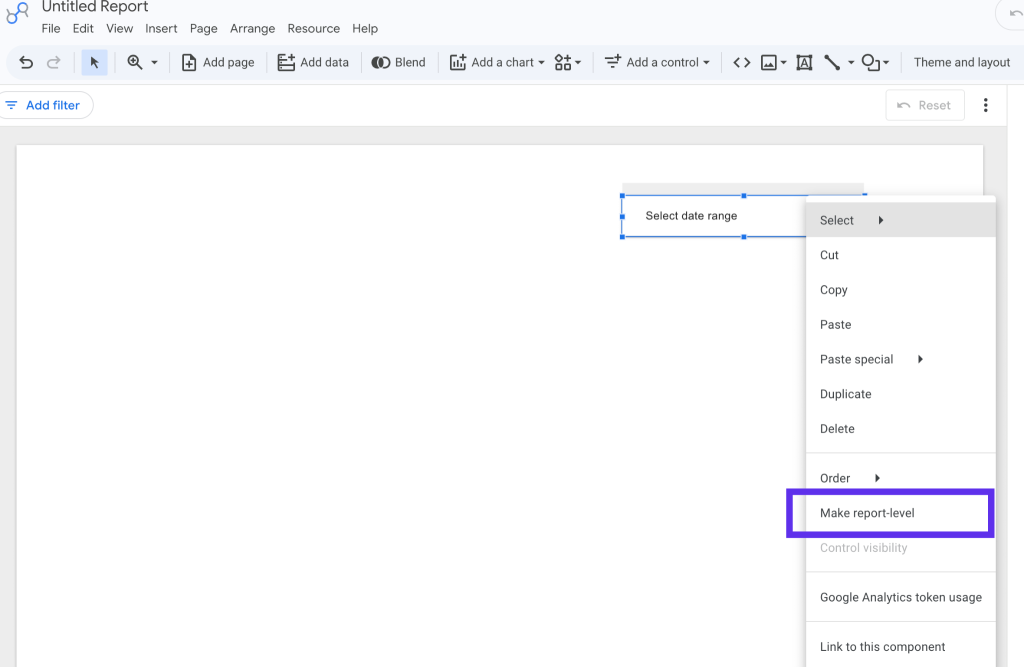
Once applied, this filter will now control charts across all pages in the report.
How to Make the Date Filter Chart-Level
Sometimes, you may not want all charts to follow the same date range. For example, you might want:
- One chart showing last 7 days
- Another showing last 30 days
Here’s how to control that.
Option 1: Set a Fixed Date for a Chart
- Click on the chart
- Go to the right panel
- Change Default date range from Auto to a fixed option
This chart will now ignore the main date filter.
Option 2: Use a Separate Date Filter for Specific Charts
You can also:
- Add another Date range control
- Place it near a specific chart
- Set it to control only selected components (using grouping)
This allows more flexible, section-based filtering.
Things to Check
- Make sure charts use a valid date field
- Ensure charts are set to Auto date range if you want them to respond
- Be careful when using multiple data sources
Best Practices
- Place the main date filter at the top of the dashboard
- Use a common default like last 28 or 30 days
- Keep filters simple and easy to understand
- Test your dashboard after setup
Final Thoughts
Adding a date filter in Looker Studio is one of the easiest ways to make your dashboard more interactive and user-friendly. Whether you use it at the page level, report level, or chart level, it gives you flexibility to explore data without changing the structure of your report.