
Last year I was doing a tracking audit for a client running a mid-size e-commerce app. They had a GTM deployment push that went out on a Thursday afternoon. By Friday morning, their add_to_cart event had dropped to zero. Not slowed down — zero. The engineer who pushed the update had accidentally broken the dataLayer trigger.
They didn’t find out until Monday when a product manager pulled a weekend report and the numbers looked wrong. Three days of missing conversion data, gone.
Would Data Volume Monitoring have caught it? Yes. Within 24 hours of the drop, they would have gotten an email. Instead, they found out through a confused Slack message and a weekend of panicked retroactive debugging.
If you’re on Mixpanel Enterprise and you’re not using Data Volume Monitoring, this post walks you through what it is, how to set it up, and how to think about it in practice.
What Is Data Volume Monitoring?
Data Volume Monitoring is a data governance feature that watches your Mixpanel project for sudden, drastic changes in event volume and notifies the right people so they can investigate and fix the issue before it compounds.
It lives at the project level and is available exclusively on Enterprise plans. For new Enterprise customers joining from December 2025 onwards, it’s automatically enabled by default on all new projects. If you’re an existing customer or working on an older project, you’ll need to turn it on manually.
The core idea is simple: your events should fire at a reasonably predictable rate. When purchase goes from 800 events a day to 80, or from 800 to 8,000, something is wrong — either in your implementation or in reality — and someone needs to know about it immediately, not three days later.
How It Works Under the Hood
Before you set it up, it’s worth understanding the logic it uses to decide when to fire an alert. A few specifics matter here.
The baseline it uses. Mixpanel looks at up to 24 months of historical event volume to determine an “expected” range for each event. This means the longer your project has been running, the smarter its baseline becomes. A brand-new project won’t have much history to work with, but an established implementation will have seasonality, weekly patterns, and growth trends baked into the expected range.
The threshold for triggering an alert. Volume needs to be at least 50% higher or lower than the expected range before a notification goes out. This isn’t a hair-trigger system. A 20% dip on a slow Tuesday won’t generate noise. A complete drop to zero, or a sudden 3x spike, will.
What events it monitors. It analyzes up to 1,000 of your most active events — specifically events that have had a volume of 100 or more for at least half of the last month. Low-volume or sporadic events are excluded. This keeps the signal clean and focused on events that actually matter to your implementation.
How often it checks. Once per day. Notifications are also sent at most twice per day per project, even if multiple spikes or drops are detected. So if five events all went sideways at the same time, you won’t get five separate emails — they’ll be batched.
The look-back window. By default, it inspects event volume for the previous day. If your pipeline has known ingestion delays, you can switch to a 2-day look-back window to compensate. This is worth considering if you’re sending server-side events through a queue that can lag.
Step 1: Navigate to Data Volume Monitoring Settings
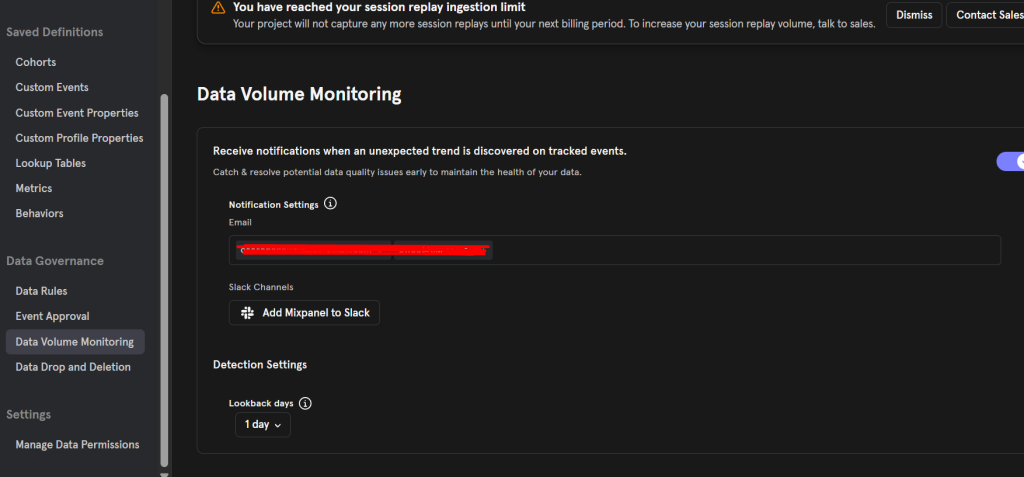
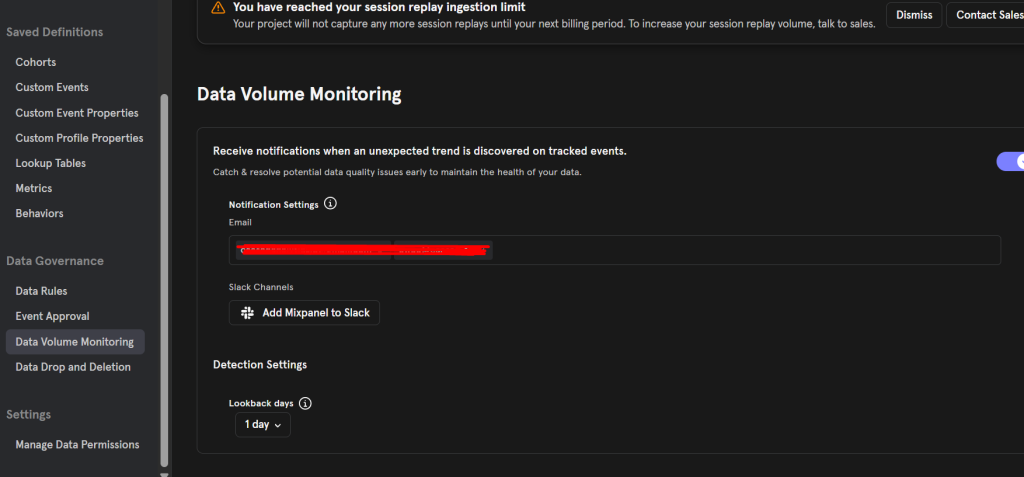
To configure Data Volume Monitoring, go to your Mixpanel project and open Lexicon. In the left-hand menu under Data Governance, click on the Data Volume Monitoring section.
If you don’t see this section, check two things first: your account must be on an Enterprise plan, and you need to be logged in as a Project Admin or Project Owner. Analysts and regular members don’t have access to enable or configure this setting.
Step 2: Add Your Notification Recipients
When you enable the setting, you’ll be prompted to input the email addresses or aliases that should receive alerts when a spike or drop is detected.
A few things to know here:
Only project admin and owner email addresses are valid recipients. You can’t route alerts to an analyst, a contractor, or a generic inbox that isn’t tied to an admin or owner account in that project. This is an intentional gate — Mixpanel wants the people getting these alerts to be people with the authority to investigate and take corrective action.
Use a team alias if you can. If your engineering or data team has a shared email alias — something like data-alerts@yourcompany.com — and that alias is tied to an admin account, that’s the cleanest setup. It means the alert doesn’t disappear into one person’s inbox when they’re on vacation.
Add a Slack channel. In addition to email, you can configure a Slack channel to receive notifications. For most teams I work with, Slack is where incidents actually get triaged. Setting up a dedicated #mixpanel-alerts or #data-monitoring channel and routing notifications there means alerts get seen and discussed by the right people in real time rather than sitting in an email inbox.
Step 3: Choose Your Look-Back Window
The default setting inspects event volume from the previous day. For most implementations, this is fine.
Switch to the 2-day look-back if either of these apply to your setup:
- You’re using server-side tracking with a message queue or batch processing that can introduce delays between when events happen and when they arrive in Mixpanel
- You’ve noticed historical patterns where your event volume in Mixpanel tends to finalize 24–36 hours after the events actually occur
Using a 2-day look-back means the system is comparing against slightly older data, which smooths out ingestion lag. The trade-off is you’ll catch issues a day later than you would with the default. For most teams, the 1-day default is the right choice unless you have a specific reason to change it.
Step 4: Save and Wait for the First Run
Once you’ve added your email recipients (and optionally your Slack channel) and selected your look-back window, save the configuration.
Data Volume Monitoring begins monitoring as soon as it’s enabled, but it may take up to 24 hours to run for the first time. After that initial run, it checks once per day going forward. Don’t expect an immediate alert confirmation — the first you’ll hear from it is if it detects something outside the expected range during its daily check.
What to Do When You Get an Alert
An alert is the beginning of an investigation, not the end. Here’s the sequence I walk through when a Data Volume Monitoring notification comes in.
Check the event in the Events report first. Pull up the flagged event in Mixpanel and look at the volume trend over the last 7–14 days. Is this a clean drop to zero (likely a tracking break), a gradual decline (possibly a product change or user behavior shift), or a sudden spike (possibly a tracking loop, duplicate firing, or a viral traffic event)?
Check whether it’s isolated or widespread. If one event dropped, look at related events. If add_to_cart dropped but product_view is fine, the issue is likely specific to that cart tracking trigger. If everything dropped simultaneously, it’s more likely a global tracking issue — a broken GTM container, a server-side tag that stopped working, or a consent management platform update that started blocking all events.
Check your deployment history. Most tracking breaks happen within hours of a code push, a GTM publish, or a third-party script update. If you have a deployment log, cross-reference the timing of the volume change with recent deployments.
Check your server-side setup if applicable. If you’re running server-side GTM via Stape or a similar setup, verify that your tagging server is healthy, your client template is receiving hits, and your GA4 or custom server-side tags are firing correctly. A spike in 4xx or 5xx responses in your server container logs is usually the tell.
Don’t dismiss a spike as “good news.” A sudden volume increase can be just as problematic as a drop. It often indicates duplicate event firing — a trigger that fired twice per session, a dataLayer push inside a loop, or a server-side event that got called multiple times per transaction. Inflated event counts corrupt your conversion metrics, your funnel analysis, and anything downstream that’s using Mixpanel data for attribution.
What It Won’t Catch
Data Volume Monitoring is a volume anomaly detector. It tells you when the quantity of events changes significantly. It doesn’t tell you anything about the quality of those events.
An event can fire at its perfectly normal volume with completely wrong property values — a purchase event with revenue: 0 on every transaction, a signup event missing the plan_type property, a page_view event where url is always undefined. Volume monitoring won’t surface any of that. For property-level data quality issues, you need separate validation — either through custom alerts, schema enforcement at the source, or a dedicated data quality tool.
Similarly, it only monitors your 1,000 most active events. If you have a low-volume event that’s critical to a specific flow — like a rare enterprise-only action that only fires a handful of times per day — it won’t be in scope for automated monitoring. Keep a manual eye on your low-volume critical events.
A Few Configuration Notes Worth Keeping
- The feature starts monitoring immediately on enable, but the first check happens within 24 hours, not instantly
- Notifications are batched — at most 2 per day per project, regardless of how many events are flagged
- You can disable the feature at any time from the same Data Governance section in Lexicon
- Only Project Admins or Owners can enable, configure, or disable this setting
- The expected range calculation uses up to 24 months of history — newer projects will have less precise baselines until enough history accumulates
The Bottom Line
Data Volume Monitoring doesn’t replace active QA or a robust tracking validation process. What it does is give you a safety net for the most damaging class of tracking failures — the ones that go undetected for days because nobody happened to pull a report that showed the break.
Three days of missing purchase data, add_to_cart events silently at zero while your marketing team optimizes campaigns against it, a double-firing trigger inflating your conversion rate for a week — these are the scenarios it’s designed to catch. Not every problem, but the ones where time to detection is the most expensive variable.
If you’re on Enterprise, enable it today. Add your Slack channel. Set up the look-back window that matches your ingestion reality. Then go back to building, knowing that if something significant breaks, you’ll know about it tomorrow morning instead of next Monday.