
I was doing a Mixpanel setup review for a SaaS company last year. Single project, about 60 users across engineering, marketing, product, and customer support. All of them had access to the same event list, the same user profiles, the same everything.
The support team was accidentally running reports that included internal employee data, skewing their ticket resolution metrics. The marketing team kept seeing debug events from engineering and didn’t know to ignore them. And buried in the user profile properties was an email field and a phone_number field that every single person in the project could filter by and export — including contractors.
None of this was intentional. It was just the default state of a project that had grown without any access architecture around it.
Data Views and Data Classification are the two tools that fix this. They’re separate features that solve different problems, but together they give you a complete layer of access control inside a single Mixpanel project without having to split your data across multiple projects.
The Two Features and What They Each Solve
Before getting into the how-to, it’s worth being clear on the distinction.
Data Views control what data a user or team sees when they open Mixpanel. You can filter a Data View to only show events from a specific region, only show data from real users (not internal employees), or only surface events relevant to a particular team. The data that falls outside a user’s Data View is invisible to them — it doesn’t show up in reports, dropdowns, or cohort builders.
Data Classification controls access to specific sensitive properties — things like email addresses, phone numbers, payment information, or any other field you’ve decided should be restricted. Even if a user can see an event, if a property on that event is marked as Classified and the user doesn’t have permission to view classified data, they can’t use that property as a filter or breakdown.
Data Views are about scoping the dataset. Data Classification is about restricting specific fields within that dataset. You can use them independently or together.
Data Views are available on Growth plans and above. Data Classification requires an Enterprise plan.
Part One: Data Views
Step 1: Understand the Default State
Every Mixpanel project starts with a single Data View called “All Project Data.” This view has no filters and gives every user access to everything in the project. It’s the equivalent of no Data Views at all — the baseline.
Any new user added to your project is placed into “All Project Data” by default unless you change the default. If you want new users to land in a more restricted view, you can change the default Data View at any time in Project Settings.
Step 2: Create a Data View
Go to Project Settings and look for the Data Views section in the left-hand menu. In the top right, click + Create Data View.
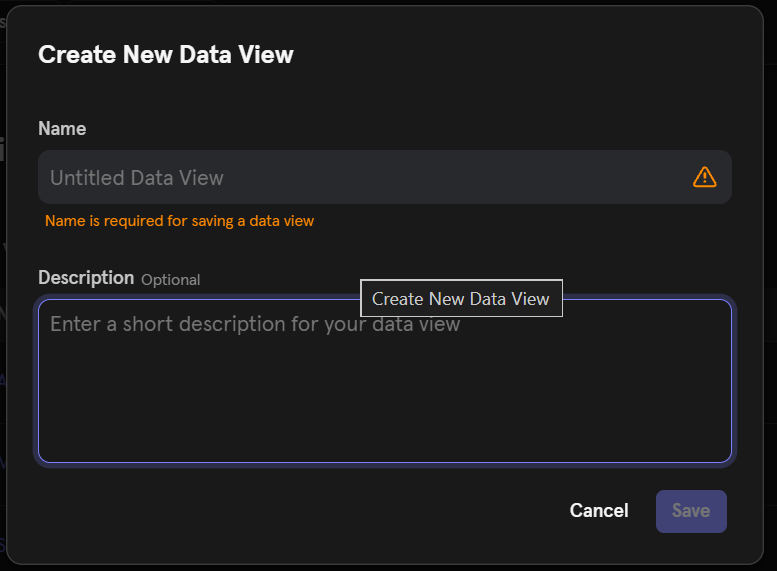
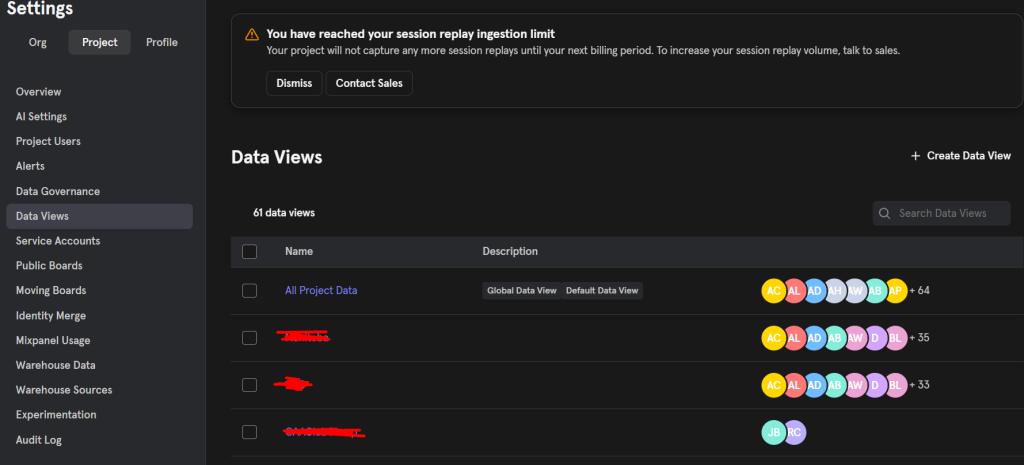
Give it a name (up to 255 characters) and a description that’s clear enough for another admin to understand its purpose six months from now. Click Save.
You’ll then land on an overview screen for that Data View, where you can configure filters, manage access, and set visibility and editing controls.
Some examples of Data Views worth creating for most mid-to-large teams:
Excluding internal users. Filter out events where a user property like is_internal equals true, or where the user’s email domain matches your company domain. This gives your marketing and product teams a clean customer-only view without internal employee activity polluting their numbers.
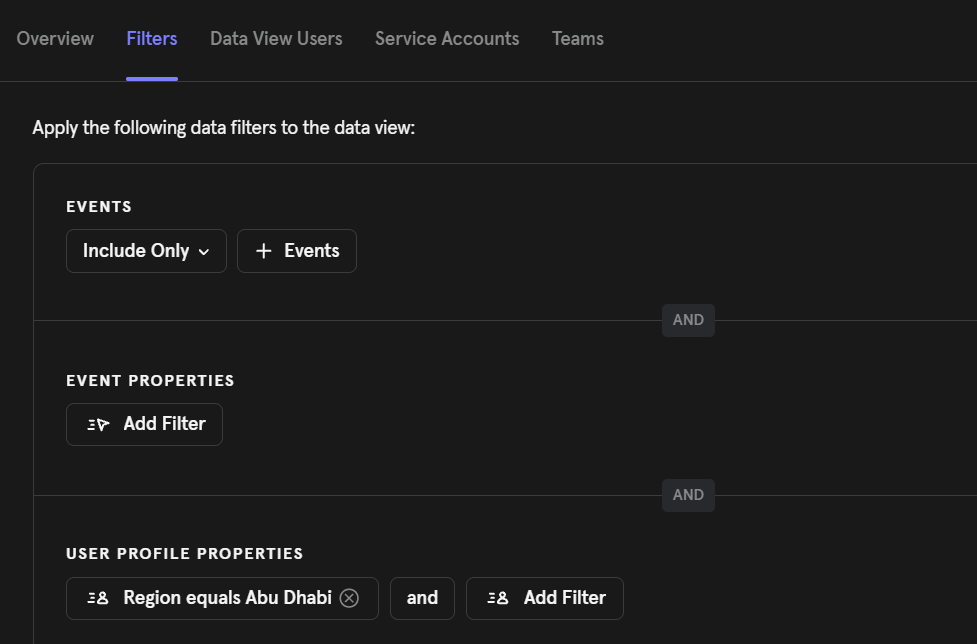
Region-specific views. Filter by a geography property — country, region, or city — to give regional teams access to only their relevant data. A marketing team focused on Southeast Asia doesn’t need to see US customer behavior in their default view, and vice versa.
Platform or app version views. If engineering is debugging a specific app version or platform, create a Data View filtered to that version. Analysts working on iOS don’t need Android data contaminating their funnels.
Verified events only. If you’re using Mixpanel’s Verified Data feature (Enterprise), you can create a Data View that only includes events marked as verified. This is a good default view for business stakeholders who should only be working with production-grade, trusted events.
Step 3: Configure Filters
Inside each Data View, the Filters tab is where you define exactly what data is included.
You can filter by events, event properties, and user profile properties. Multiple filters can be combined. The logic works like an AND condition — a user in this Data View only sees data that matches all the filters you’ve defined.
Think carefully about how you define filters here. A filter on a user profile property like country = "US" will affect all events for non-US users — they won’t appear in reports, funnels, cohorts, or anywhere else for users inside that Data View. This is powerful but worth testing before you roll it out to a team, because the effect is invisible to the user — they just see less data with no indication that a filter is active beyond the banner notification when they enter the view.
Step 4: Set Visibility and Editing Controls
Each Data View has two settings worth thinking through carefully.
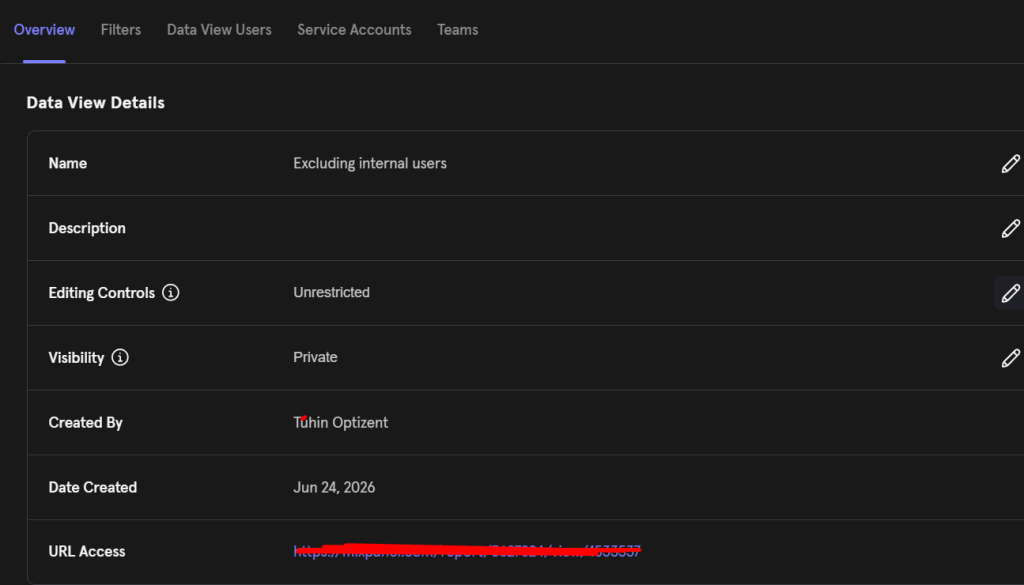
Visibility controls whether the Data View appears in the Data View Library and whether project members can self-join it. Set it to Public if you want team members to be able to discover and join it themselves. Set it to Private if access should be invitation-only — the Data View won’t appear in the Library to users who haven’t been added.
Editing Controls determine whether other admins can modify the Data View’s settings and filters. Restricted means only the creator or a Project Owner can make changes. Unrestricted means any admin can edit it. For sensitive Data Views — particularly ones scoped to restrict data access for compliance or privacy reasons — set this to Restricted. You don’t want another admin accidentally widening the filter scope.
Both of these settings can only be changed after creation by the original creator or a Project Owner. Choose thoughtfully the first time.
Step 5: Add Users and Teams
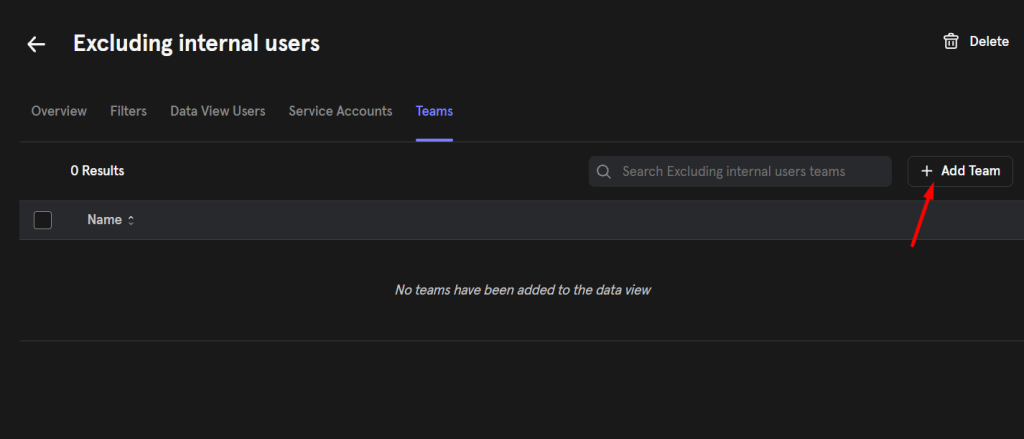
In the Access tab of each Data View, you can add individual users or entire teams.
Click + Add User to search for and add project members individually. To add teams, click the Teams tab and select the relevant team.
If your organization uses Single Sign-On with an identity provider connected to Mixpanel, you can define team membership at the IdP level. When a new employee joins and gets added to a team in your identity provider, they automatically inherit that team’s Data View access in Mixpanel. This is the cleanest way to manage access at scale — instead of manually adding and removing individual users every time someone joins or leaves, you manage it through team membership and let SSO handle the propagation.
Step 6: Change the Default Data View
If you want new users to land in a specific Data View rather than “All Project Data,” go to the Data Views list in Project Settings, check the box next to the Data View you want to set as default, and click Set Default.
This is worth doing as soon as you have a coherent Data View structure in place. Every new user who gets added to the project will start in the default view, so setting it thoughtfully prevents the situation where a new analyst gets full unfiltered access because nobody changed the default.
Using the Data View Library
Project members can access the Data View Library by clicking the project name in the upper-right corner and selecting Data View Library. From there they can see which Data Views they’ve already joined, discover public Data Views, and join any public view on their own.
Private Data Views don’t appear in the Library to users who haven’t been granted access. Users who have been added to a private Data View can see it in their Library, but no one else can.
A Few Behaviors Worth Knowing
Saved content is not scoped to a Data View. A report you build while in the Marketing Data View is accessible from any other Data View you have access to. The report itself is portable. What changes is the data it returns — the same funnel report will show different numbers depending on which Data View you’re currently in, because the underlying data filter changes.
Lexicon reflects the current Data View. When you’re inside a Data View with filters, Lexicon will show events and properties filtered to that view. But if you edit an event or property in Lexicon while in one Data View, that change applies across the entire project and affects all Data Views. Metadata edits in Lexicon are project-wide, not view-specific.
APIs behave differently depending on the authentication method. APIs using Project Token or Secret work at the project level and ignore Data View filters. APIs using OAuth work at the Data View level. If you have downstream systems pulling data via API, know which auth method they use before assuming Data View filters will apply.
JQL is only available in the “All Project Data” view. If any of your team members use JQL, they’ll need access to the unfiltered view to run those queries.
Part Two: Data Classification
What It Solves
Data Classification handles a different problem than Data Views. Where a Data View controls which events and users a person can see, Data Classification controls whether a person can access specific sensitive properties — even if they can see the event those properties are attached to.
The common use case is PII. You might want your entire analytics team to be able to use the purchase event in reports, but only a subset of that team to be able to filter by email or phone_number. Data Classification lets you make that distinction without splitting your project or creating duplicate events.
Step 1: Mark Properties as Classified
Go to Lexicon and open either the Event Properties or User Profile Properties tab, depending on which properties you want to restrict.
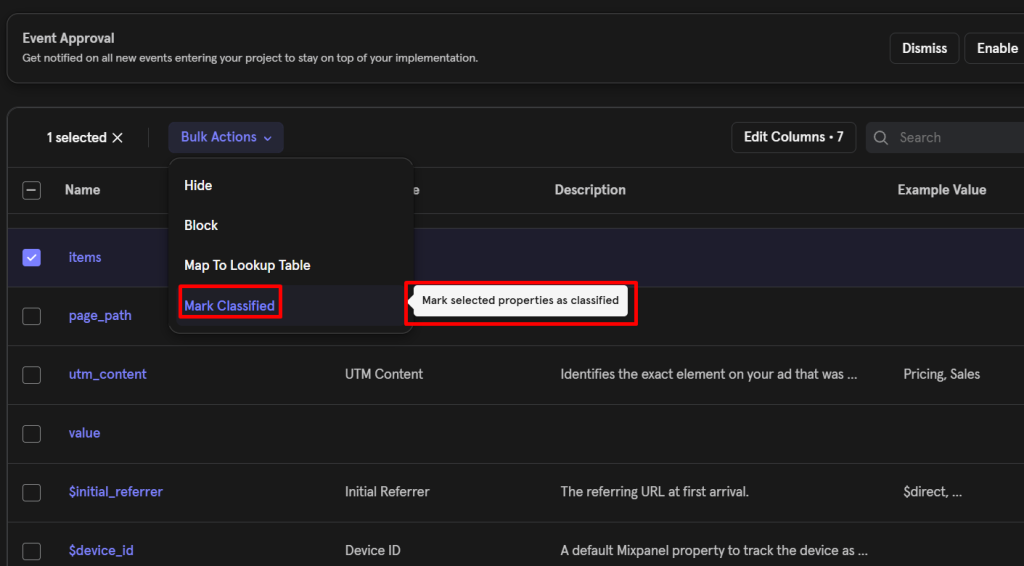
Select the property or properties you want to classify. You can select multiple at once. Click Mark Classified. A confirmation popup will appear — confirm, and those properties are now classified.
In the Status column, classified properties show their classification status alongside their visibility state. If the Status column only shows a visibility state (visible or hidden) with no classification marker, the property is not classified.
Only Project Admins and Owners can mark properties as classified. Analysts and regular members cannot change classification status.
Step 2: Manage Who Can View Classified Properties
Marking a property as classified doesn’t automatically decide who can see it. That’s a separate step.
For individual users: Go to Project Settings and select the Project Users tab. In the Current Users table, find the Classified Data column. Each user has a Can View checkbox in that column. Check it to grant access, uncheck it to revoke. Update this for each user who should or shouldn’t have access to classified properties.
For teams: Go to Organization Settings (the gear icon in the top-right navigation), open the Users & Teams tab, and click on the relevant team. You’ll see a view of that team’s access across all projects they belong to, including a toggle for classified data access per project. This is the more scalable approach for larger organizations — manage access at the team level and let team membership determine who can view classified properties.
Step 3: Understand the Experience for Restricted Users
Users who don’t have classified data viewing permission aren’t blocked from using Mixpanel. They can still work with all non-classified events and properties. But when they encounter classified data, here’s what happens:
In Lexicon, they can see that a property is marked as classified. The classification status is visible. They just can’t use it as a filter or breakdown in analysis.
In Boards, if a report on a board uses a classified property and the user doesn’t have Can View permission, they’ll see a warning when they open that board card. They can click through to the full report to identify which properties are preventing them from viewing it, but the data itself won’t render.
In analysis reports — Insights, Funnels, Flows, Retention — classified properties look the same as regular properties in the interface. The restriction isn’t visible until a user without Can View permission actually tries to run a report using that property, at which point a warning appears and the report won’t execute.
This is worth communicating to your team when you first set up Data Classification. Users will encounter warnings and may not understand why unless they’ve been told that certain properties are restricted. A brief internal note explaining the classification system saves a lot of confused support requests.
Putting Both Features Together
The most effective setup uses both features in combination.
Data Views handle the broad strokes — your support team sees only customer data, your APAC marketing team sees only Asian regional data, your engineering team sees a specific app version. These are dataset-level restrictions applied at the view level.
Data Classification handles the fine-grained stuff — even within a team’s Data View, certain PII fields are restricted to only the analysts and data scientists who have a specific need for them. Everyone else works with the same events but can’t access the sensitive properties.
Together they give you a layered access architecture inside a single Mixpanel project. You don’t have to maintain separate projects for different teams or duplicate your implementation to satisfy different access requirements. One project, clean access controls, with each team seeing exactly what they should.
Common Mistakes to Avoid
Setting the wrong default Data View. If “All Project Data” stays as the default, every new user gets full unfiltered access until someone manually moves them. Change the default as soon as your Data View structure is in place.
Using user profile property filters without knowing the Group Analytics limitation. If you apply a User Profile Property filter to a Data View, you lose the ability to analyze by Group Identifiers other than User. If your implementation uses Group Analytics — for company-level or account-level analysis — test this interaction before deploying a user property filter broadly.
Assuming Data View filters apply to Token or Secret-based APIs. They don’t. If your data warehouse sync, export pipeline, or any other API integration uses Project Token or Secret authentication, it operates at the full project level. Only OAuth-authenticated API calls respect Data View filters.
Not communicating the classification system to your team. Users without classified data permissions will hit warnings on reports and boards that use those properties. Without context, this reads like a bug. A short internal explanation of how classification works prevents confusion and repeated support questions.
Editing Lexicon from inside a Data View without realizing the impact is project-wide. Any metadata change you make in Lexicon — hiding an event, adding a description, blocking a property — applies to the entire project, not just your current Data View. Be aware of this whenever you’re doing Lexicon maintenance while in a filtered view.
The Bottom Line
Most Mixpanel projects start with everyone seeing everything. That’s fine at five people. At fifty it creates noise, at five hundred it creates compliance risk.
Data Views give you the infrastructure to scope what each team sees without maintaining separate projects. Data Classification gives you the additional layer to restrict sensitive properties within those views. Both are manageable to set up, and the combination gives you the kind of access architecture that most data teams need but rarely build until something goes wrong.
Start with Data Views. Map out your teams, identify the most obvious data scoping needs — internal vs. external users is usually the first and most impactful one — and build from there. Add Data Classification once you have a clear picture of which properties in your project carry PII or sensitivity risk. Set the Can View permissions carefully, communicate the system to your team, and you’ll have a Mixpanel project that’s actually governed, not just populated.