
A client came to me three months ago with a specific problem. Their key conversion funnel report had been showing unexpected numbers for about two weeks. The metric had dropped, then recovered, and nobody could explain why. After digging around, we found that someone had modified the cohort the funnel was filtering against — changing the definition in a way that excluded a significant chunk of users. The change had been sitting there for two weeks before anyone noticed.
The question nobody could answer was: who changed it, and when exactly?
If they had been actively using Mixpanel’s Audit Log, that answer would have taken about 30 seconds to find. Instead it took an hour of conversations and guesswork before the right person remembered making a “small tweak” to the cohort definition.
The Audit Log isn’t a flashy feature. It doesn’t improve your reports or make your funnels faster. What it does is give you an authoritative, timestamped record of every meaningful action taken inside your Mixpanel organization — and when something goes wrong, that record is the difference between a quick resolution and a prolonged investigation.
What the Audit Log Actually Captures
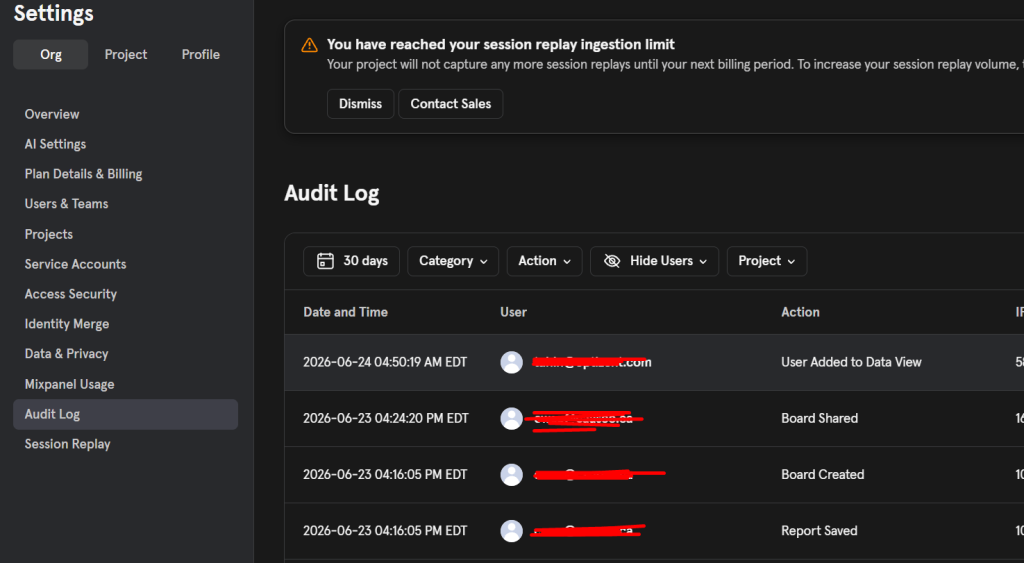
Before getting into how to use it, it’s worth understanding the scope of what Mixpanel tracks. The Audit Log records activity across your entire organization and your individual projects. Each entry tells you what happened, when it happened, and who triggered it.
The events span essentially everything meaningful that can happen in a Mixpanel account. Rather than treating the full catalog as an abstract list, it helps to think about it in terms of the questions you’ll actually be trying to answer when you open the Audit Log.
The Questions You’ll Actually Use This to Answer
“Who changed our report or board?”
The Audit Log tracks every save, update, deletion, duplication, export, and share action on reports and boards. If a saved funnel report gets modified and the numbers shift, you’ll see a bookmark.updated entry with the timestamp and the user who made the change. If a board gets deleted, there’s a board.deleted entry. If someone exported board data outside the platform, there’s a board.exported record.
Board subscriptions — the scheduled email digests people set up — are also logged. If a stakeholder stops receiving their weekly board email, you can check whether the subscription was deleted and by whom rather than spending time debugging an email delivery issue that was actually a manual deletion.
“Who touched our user data?”
This category of question matters most for compliance and GDPR-related workflows. The Audit Log captures user data deletion requests (user_data_deletion.created), cancellations of those requests (user_data_deletion.canceled), profile deletions and updates made through the Mixpanel web application, and batch profile operations.
One important caveat here: profile deletions and updates are only logged when they’re initiated through the Mixpanel UI. API calls and direct SDK updates that modify or delete profiles are not currently captured in the Audit Log. If your team uses the Mixpanel API to manage profiles programmatically, those actions won’t appear in the log. Keep that gap in mind when investigating profile-level changes.
Similarly, every data export is logged. Event exports, profile exports, raw event export requests, and user data export requests all generate entries. If you’re operating in a regulated environment and need to demonstrate that sensitive data wasn’t exported without authorization, the Audit Log gives you that trail.
“Who has access to what, and when did that change?”
Access management questions come up constantly on teams that are growing or restructuring. The Audit Log captures every meaningful access event: users added to or removed from the organization, users added to or removed from specific projects, teams added to or removed from projects and data views, role changes for both human users and service accounts, and invitations sent and accepted.
If a contractor’s access was supposed to be removed after a project ended and you’re not sure whether it was handled, you can check project.user_removed or organization.user_removed for that user and get a definitive answer. If someone’s role was escalated from Analyst to Admin unexpectedly, user.role_changed will show when it happened and who made the change.
Service account management is fully covered here too. Service accounts added to or removed from projects, role changes on service accounts, and service accounts added to or removed from teams all generate distinct log entries. For teams running server-side integrations or automated pipelines through service accounts, this is worth monitoring proactively.
“Who enabled or disabled security settings?”
Authentication events are some of the most important to have on record. The Audit Log tracks every successful login (session.logged_in), every logout (session.logged_out), and — added in May 2026 — failed login attempts (session.login_failed). If you’re seeing unusual activity and want to know whether someone was unsuccessfully attempting to access an account, the failed login entries give you that.
Organization-level two-factor authentication being enabled or disabled generates a specific log entry in both directions. If 2FA gets turned off for your organization — which should be a rare and intentional action — there will be a clear organization_access_security.twofactor_disabled entry showing who did it and when. Individual users enabling their own 2FA is also logged via user.twofactor_enabled.
“What happened with our Lexicon and data governance settings?”
Event and property definitions have their own log entries. When someone creates, updates, or deletes an event definition in Lexicon, it’s captured. Property definition changes are logged too. Event deletion requests — the irreversible kind where you’re wiping event data from the project — generate entries when requested and when canceled, giving you a record of who initiated a destructive data action and whether it went through.
Cohort changes are fully tracked as well. Cohort creation, updates, deletions, sharing, unsharing, and sync configurations all appear in the log. This is exactly the scenario from the client story at the top of this post — a cohort definition getting quietly changed would generate a cohort.updated entry that answers the who and when immediately.
“What’s happening with our warehouse connections and pipelines?”
For teams using Mixpanel’s warehouse integrations, every connection created, updated, or deleted is logged. Sync jobs — the scheduled jobs that pull data from your warehouse into Mixpanel — have their own lifecycle entries for creation, deletion, and configuration changes. If a data pipeline goes silent and your event volume suddenly drops, checking the Audit Log for recent data_pipeline.updated or warehouse_source_sync.updated entries is a fast first step in the investigation.
“What’s going on with our experiments and feature flags?”
Every stage of an experiment lifecycle is captured: created, launched, updated, concluded, archived, restored, and deleted. Feature flags follow the same pattern. If a feature flag gets archived by mistake and a feature stops working in production, the feature_flag.archived entry tells you immediately who did it and when — no Slack channel archaeology required.
The experiment agent_flow entries are worth noting separately. As of June 2026, Mixpanel logs agentic automation activity — when automations are created, updated, activated, paused, triggered, and deleted. If your organization is starting to use Mixpanel’s agentic workflow features, these entries give you visibility into automated actions alongside human-initiated ones.
“Did anyone change billing or organization settings?”
Billing changes — invoice preferences, payment information, and tax information — all generate log entries at the organization scope. These are straightforward to monitor: if your billing contact changes without your knowledge or a payment method gets updated, the Audit Log has the timestamp and the actor.
Organization-level setting changes broadly are captured via organization_setting.updated. AI settings for the organization (organization_spark_setting.updated) have their own specific entry, which is relevant for organizations that want to track when AI features are enabled or configured for their Mixpanel environment.
How to Approach the Audit Log in Practice
Use it reactively for incident investigation. When something unexpected happens — a report changes, a user loses access, data export volumes spike, a key cohort definition shifts — the Audit Log is your first stop. Filter by the event type category relevant to your incident and narrow by the time window you’re investigating. Most investigations that start with “something changed around Tuesday” can be resolved in under five minutes once you know where to look.
Use it proactively for access reviews. Periodic access audits are good practice in any organization managing sensitive data. Quarterly is a reasonable cadence. Pull the user management events from the last 90 days, look at who was added and removed from which projects, check for any unexpected role changes, and verify that service account access is still scoped correctly. This takes 20 minutes and prevents the “that contractor has had admin access for eight months and we forgot” situation.
Monitor data exports if you’re in a regulated industry. If your organization operates under GDPR, HIPAA, or similar frameworks, the data export entries in the Audit Log are part of your compliance story. Knowing that all profile exports and event exports are logged — and that raw event export requests are specifically captured — gives you the foundation for demonstrating data access controls to auditors.
Watch for destructive actions. A handful of log event types represent irreversible or high-impact actions worth treating differently from routine activity. Event deletion requests, user data deletion requests, board deletions, service account deletions, and data pipeline removals all fall into this category. If your organization has a process for approving destructive data actions, the Audit Log is where you verify those approvals were followed.
Know what it doesn’t cover. The Audit Log captures UI-initiated actions comprehensively, but API and SDK actions have gaps. Profile updates and deletions made via the API or SDK are not currently logged. If your architecture involves programmatic profile management, you’ll need your own logging at the API layer for complete coverage of those actions. Building your investigation assumptions around what the Audit Log captures — and what it doesn’t — prevents false confidence in audit completeness.
Understanding Scope: Project vs. Organization Events
Every entry in the Audit Log has a scope designation: either Project and organization or Organization only.
Project and organization events are things that happen within a specific project — report changes, cohort updates, board activity, data exports from a project, warehouse connections — and they show up in both the project-level and organization-level audit views.
Organization only events are things that happen at the account level and aren’t tied to a specific project — user login and logout, team management, service account creation and deletion, billing changes, organization settings. These only appear in the organization-level Audit Log view.
When you’re investigating something, knowing which scope you need determines where to look. A question about who changed a board lives at the project scope. A question about who added a new user to the organization lives at the organization scope. Looking in the wrong scope means missing the relevant entries.
A Reference for the Events That Matter Most
Rather than treating the full event catalog as a flat list to memorize, it helps to keep a mental map of which event types correspond to which types of questions. Here’s the shorthand version:
Something changed in a report or board: Look at bookmark.updated, board.updated, cohort.updated, alert.updated
Data left the platform unexpectedly: Look at event_export.downloaded, profile_export.downloaded, board.exported, raw_event_export.requested, user_data_export.created
Access to a project or organization changed: Look at project.user_added, project.user_removed, organization.user_added, organization.user_removed, user.role_changed
A security setting was changed: Look at organization_access_security.twofactor_enabled, organization_access_security.twofactor_disabled, session.login_failed
Data was deleted or a deletion was requested: Look at user_data_deletion.created, event_deletion.created, profile.deleted, profile.batch_deleted
A warehouse connection or pipeline changed: Look at warehouse_source.created, warehouse_source.updated, warehouse_source.deleted, data_pipeline.updated
An experiment or feature flag changed: Look at experiment.launched, experiment.concluded, feature_flag.updated, feature_flag.archived
An automated workflow ran or changed: Look at agent_flow.triggered, agent_flow.updated, agent_flow.activated, agent_flow.paused
The Bottom Line
The Audit Log is the kind of feature that feels unnecessary until the exact moment you need it urgently. By then, if you haven’t been using it, the information you need either doesn’t exist or requires a much longer investigation to reconstruct.
The practical setup is simple: familiarize yourself with the scope model, know which event types correspond to the kinds of incidents your team is most likely to face, and build the Audit Log into your access review cadence rather than treating it as something you only open when something goes wrong.
For teams managing compliance requirements around data access and export, it’s not optional — it’s the audit trail that demonstrates your controls are working. For everyone else, it’s the fastest way to answer the question that always comes up eventually: “who changed this, and when?”