
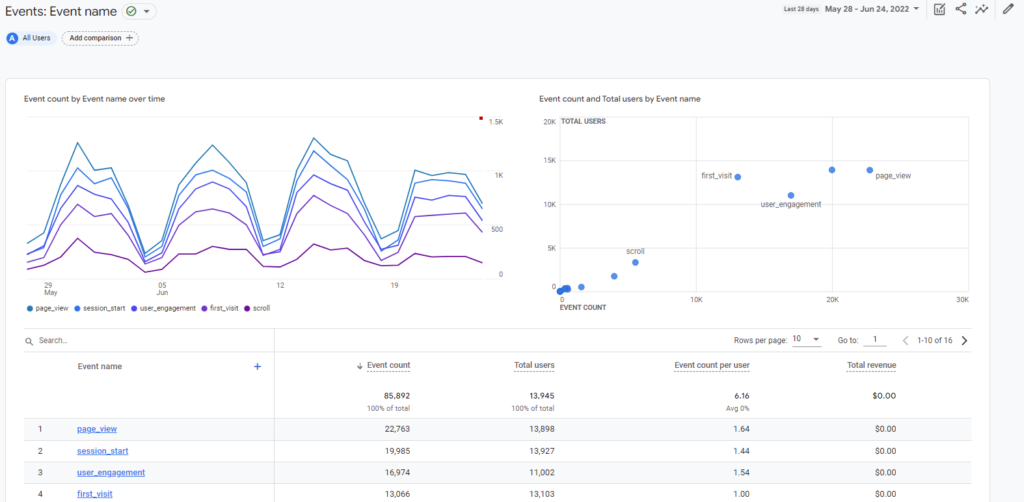
GA4 comes with several predefined detailed reports. In all these reports you see 3 two charts on the top followed by the data in tabular format (see below)

Do you know that you can change the graph types that show up in this report?
Click on the "Pencil" icon in the top right corner.
This will open up the "Report Customization" screen, see below
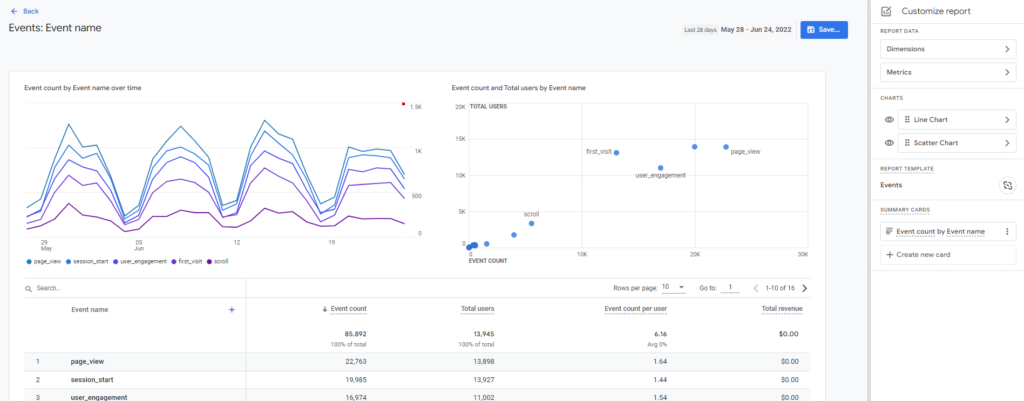
In this screen, on the right-hand side, you will see two links under the "Charts" section. The two links represent the two charts that you see in the report.
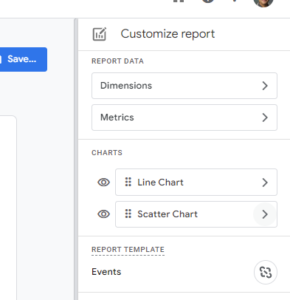
To hide a particular chart, click on the "Eye" icon next to the chart.
To change the char type, click on the arrow next to the chart. This will open up a screen to change the chart type.
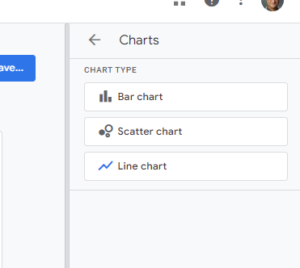
Pick the chart type from here and click on the "Apply" button at the bottom.
The new chart type will now show up in your report.
To get more such tips in your inbox, sign up at https://academy.optizent.com/f/ga4-insights-in-your-inbox
Google Analytics 4 help and support
We are here to help you with all your Google Analytics needs. Our team can get you up and running in no time and also train you and your team to save you a lot of time so that you can focus on driving the business outcomes rather than configuring Google Analytics 4.
Online Course - If you want to learn on your own then check out Google Analytics 4 Masterclass
Workshop - We conduct the onsite customized workshop. Reach out to us for more details.
Upskill your team on GA4 with our live training session with your own data and reports. Contact us ta support@optizent.com
Consulting - Reach out to us for more details.