
This article is about Google Analytics 4 acquisition reports and explains what data Google Analytics uses and how it presents the data. Then, how to use that information to help your business.
Before going into the acquisition reports, understand the data that Google Analytics 4 collects and how it manifests into the data that can be seen in reports. For example, a user coming to the website or app for the first time. This is their first ever visit to the website or app.
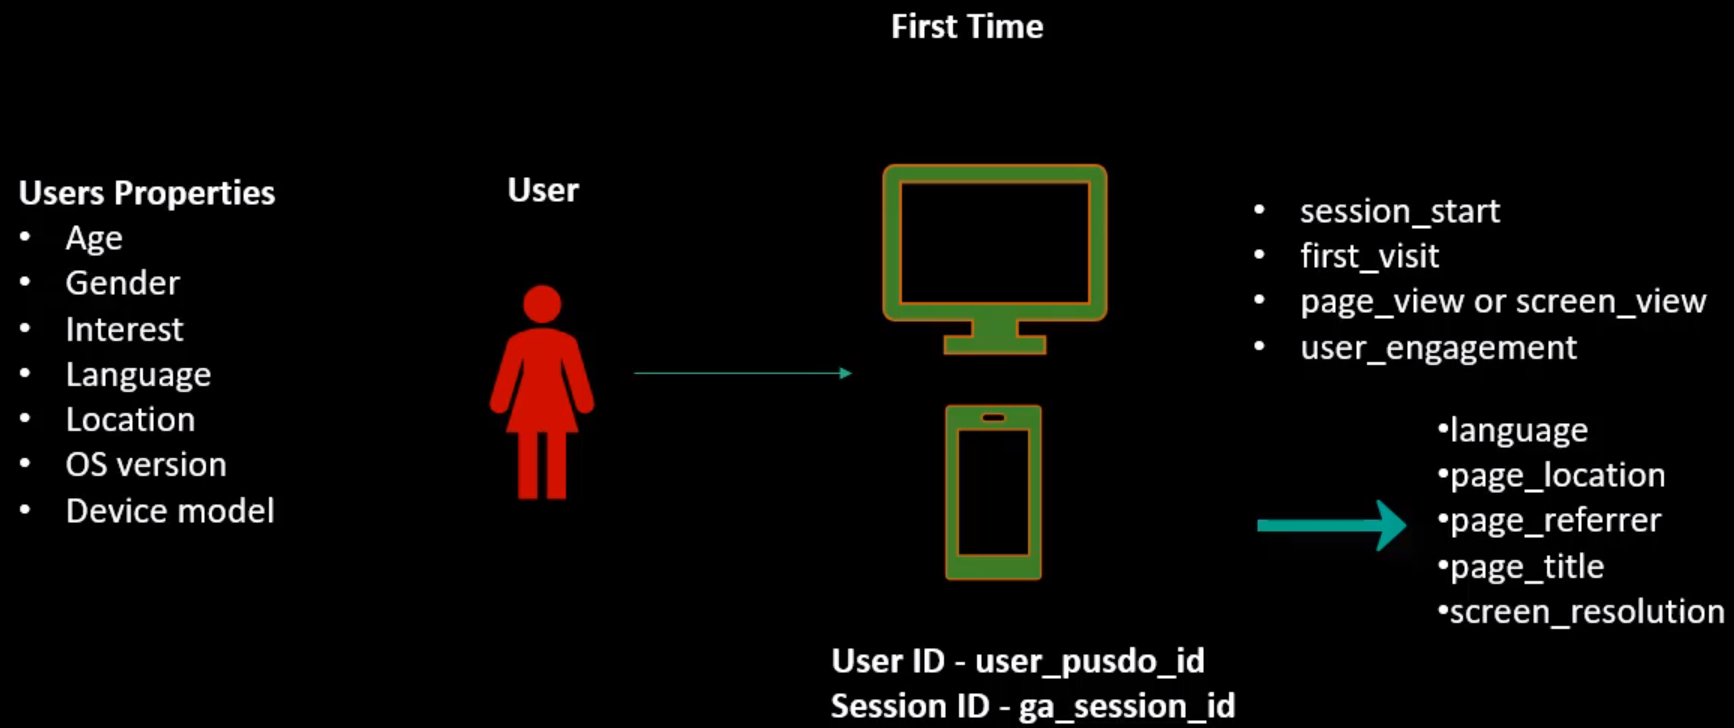
When a user comes in Google Analytics at that point, drops a cookie, and assigns this user a user ID, which will be shown as a user pseudo ID in the back end. Unless we export Google Analytics data into BigQuery, it doesn't matter what it is called behind the scenes.
In addition to the user ID, Google Analytics also assigns a session ID to this user's visit or session on the site. User ID remains the same for that user as long as on the desktop. The user does not delete the Google Analytics tracking ID cookie and, in the case of an app, does not uninstall the app and install it again. So it gets assigned by Google Analytics to identify the user throughout their lifecycle of engagement with the site or app. Session ID, on the other hand, changes with every visit or session of the user on the site or app. Thirty minutes of inactivity between engagements on the website or app leads to a new session id.
Google Analytics, by default, tracks certain events. When a user comes to the site or app, it has an event called Session Start which marks the start of this user's session. Then it has an event called First Visit, which tracks if this is the user's first visit to the app or site or not. Triggers an event called page view, or screen view, page view for desktop and screen view for mobile apps, and then starts User engagement with the site or app.
User engagement keeps track of the time users spend on the site. All these events also have certain parameters that they capture. The default parameters are the language, which is the language derived from the browser settings of the user page location, which is the URL of the page that the user is on.
Page Referrer captures the information about where the user is coming from. This information gets further divided into source and medium. It captures the page title of that page where the user is on and the screen resolution, which is the screen size of the computer or mobile device that the user is on.
All these events and these parameters translate into the reports along with it. It also captures users' properties, age, gender, interest, and language are the properties that Google has in Google's database. Google won't have this information for all the users that come to the site or app.

Based on the user's IP address, Google Analytics derives that user's location. This information includes region, country, city, and state, and then it tracks information about the technology the user is using, such as the operating system of the device they are using, as well as the model of the mobile device. Page referrer contains information about where the user is coming from to the site or app.
Google Analytics splits the page referrer information into two dimensions: source and media. Assume the user is coming from the Google search engine. User searches for a particular keyword, find the site in the search results, clicks on it, and lands on the site.
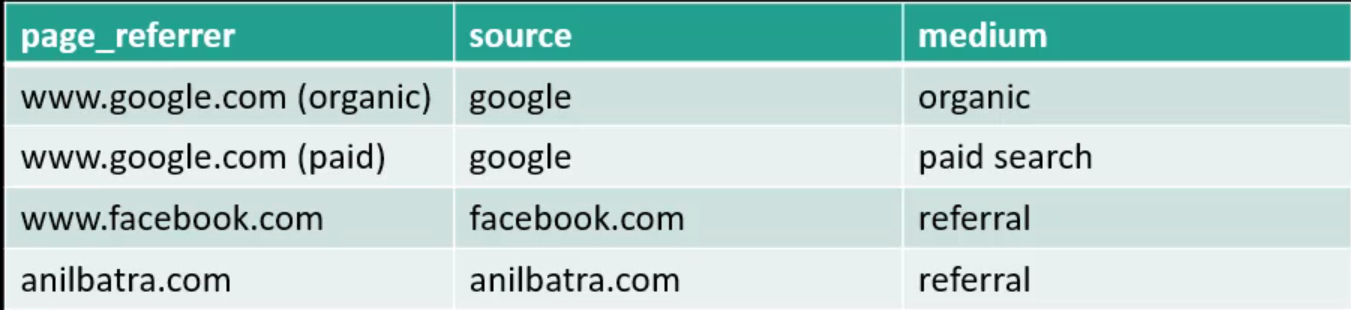
Looking at the page referred information, Google knows that this user came from Google and whether this user clicked on an organic listing or the paid listing on Google, it uses that information to provide the source and medium values. Similarly, if a user comes from a link shared on Facebook, then Google knows the user came from Facebook and splits the information into the source of Facebook.com and Medium of Referral.
Along those same lines, if it has a link on anilbatra.com for this site.
Then the source becomes Anilbatra.com, and the medium becomes referral. When a person runs campaigns or places the links on third-party sites, they can pass source and medium values in the URLs so that Google Analytics can use those values for source and medium.
Let's check Google Analytics and see how this translates into the reports. Expand the Acquisition menu option, and we can see three reports Overview, User Acquisition, and Traffic acquisition.
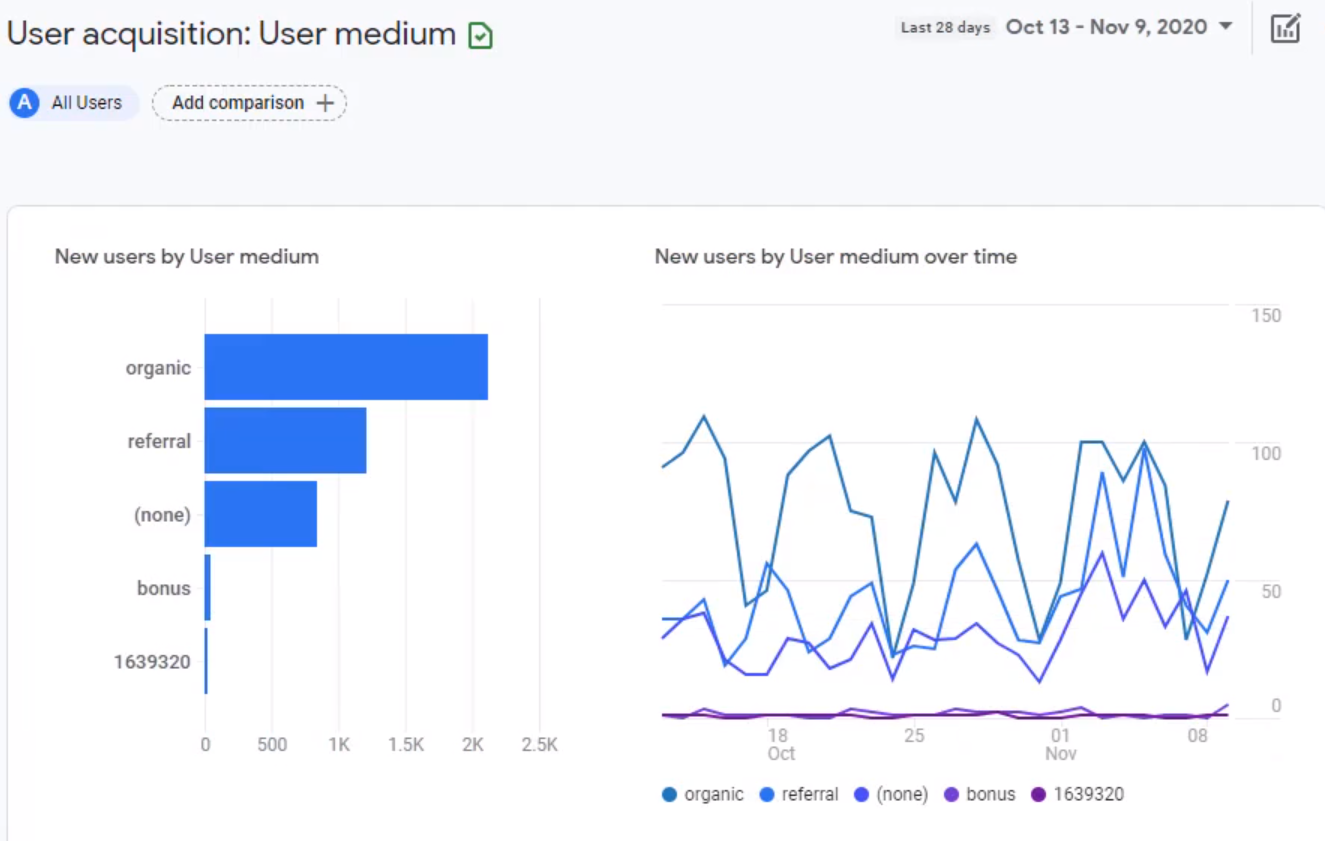
User acquisition is all about acquiring the user. Where did the user first find out about the site? So this is for the first visit. The user is brand new to the site. We can see new users by the medium. Remember, the medium is automatically categorized based on the page referral information. On the right side, we can see the trend of new users over time.
Below this, we can see a tabular view of the data. Most of the reports in Google Analytics will have this tabular format. They have the dimensions listed vertically and then various metrics in different columns. Dimensions are the various categories in the data, while metrics are the actual numbers of those categories.
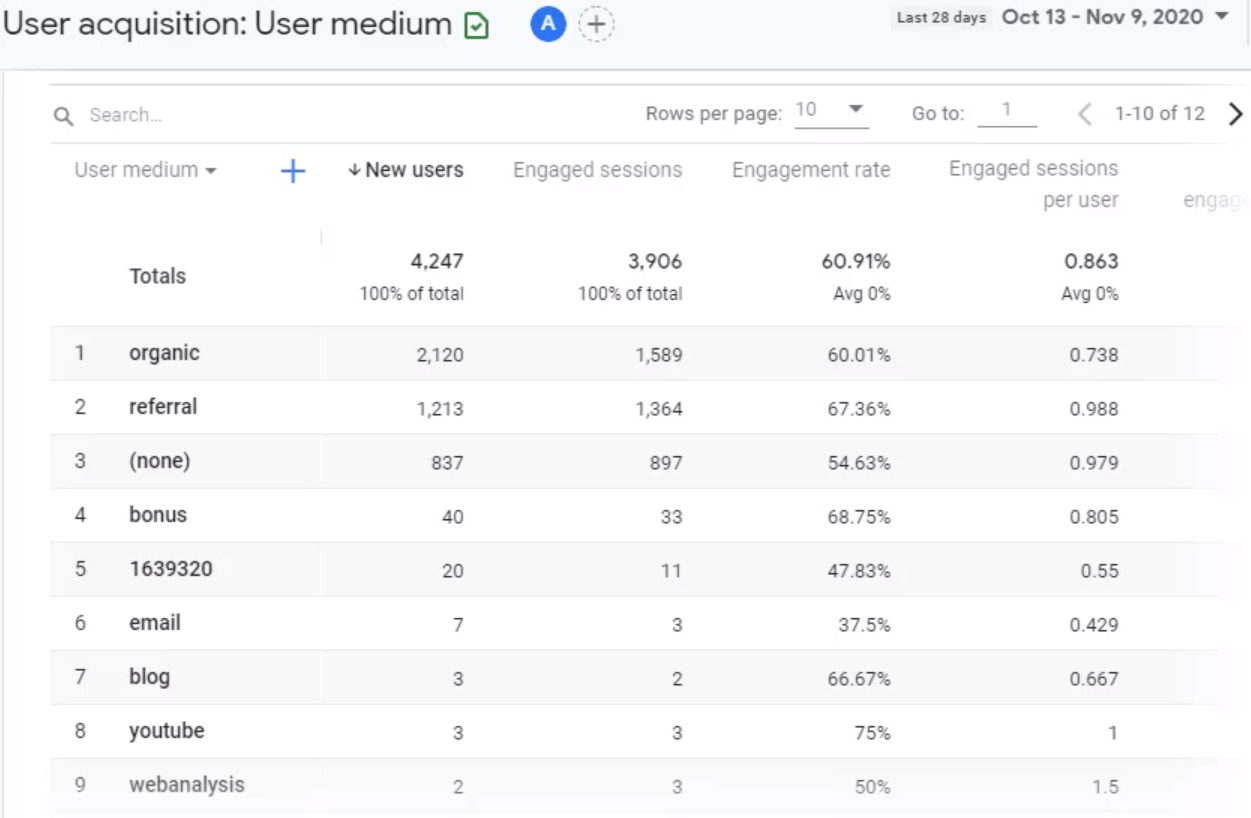
In this case, the dimension is user medium, which is listed on the top left side of the chart, and then the metrics are new users, engage sessions, engagement rate, etc., and they are listed in different columns. To change the dimension, go to the top left dimension menu, click on the dimension, and it will open up a list of other available dimensions. We can pick the dimension from this list, and it'll show up on that menu. Let's look at these metrics in detail and see what they mean. When we hover over any of these metrics, we can see the definition of that metrics.
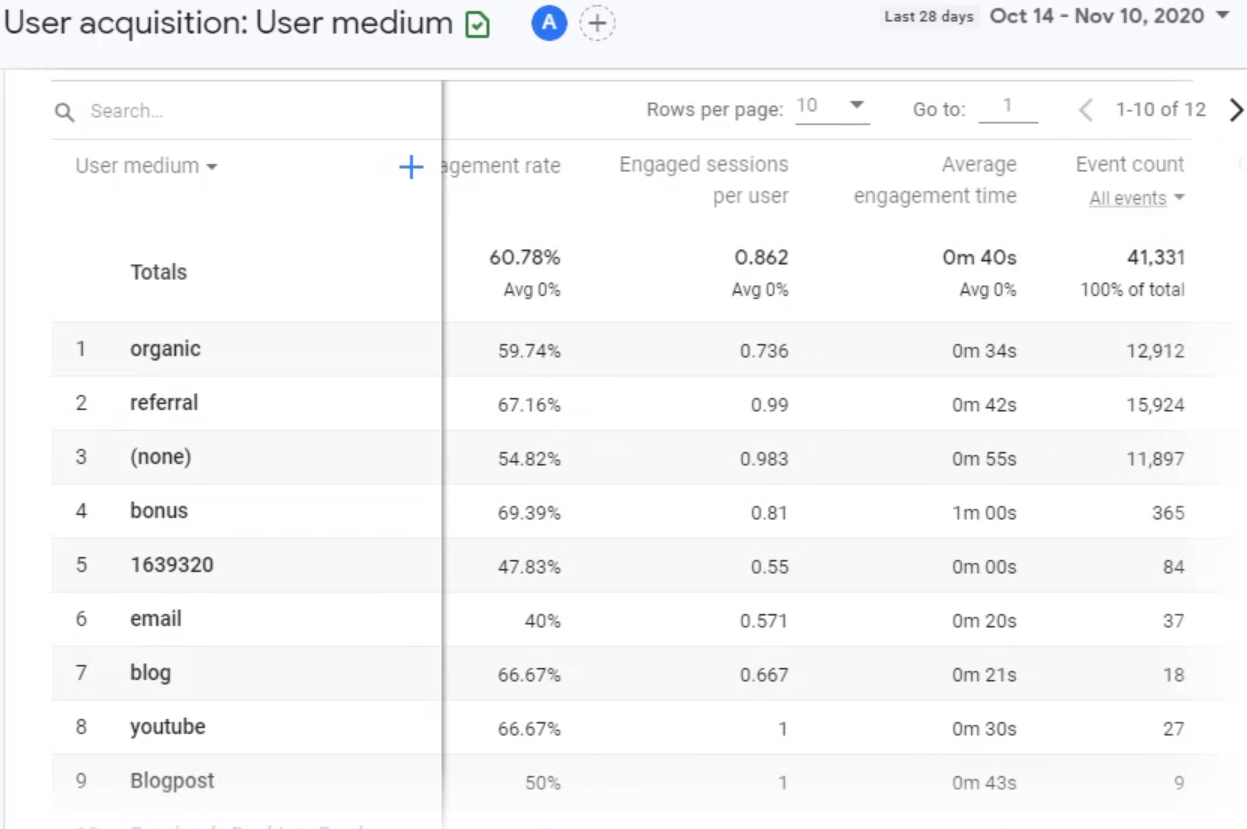
New Users is a count of users who came to the site or app for the first time via the medium listed in the first column. Next, we have engaged sessions. The engaged session is a session that spends at least 10 seconds, has a conversion event, or has two or more screen views or page views.
Remember, these are sessions. A user can come to the site or app multiple times during that time frame, and each time the user comes back, as long as there is a 30 minutes inactivity between those visits, they are considered a new session or visit.
Next, we have an engagement rate. Engagement rate is the percentage of engaged sessions. That means the number of engaged sessions is divided by the total sessions. So, in this case, this number is divided by the total engaged sessions. The total engaged session is the number right on top engaged sessions. Engaged sessions divided by the total calculates this percentage.
Next, we have engaged sessions per user which means how many sessions were engaged divided by the total number of users. The engaged session per user is expressed as a fraction. Then we have average engagement time. This is the average length of time that the app was in the foreground or the website focused on the browser. So it measures the actual attention of the user and how much time they spend looking at the app or website.
So if a user opens up the app and then moves it to the background, then the time the app was in the background is not measured. And in the case of a website, if the user moves the site to a window that's in the background or a tab that's in the background, then that time is not measured.
Next, we have event counts, the total number of events the users triggered on your site or app. Remember, some events are automatically tracked by Google Analytics, and then we can have our own custom events too. All those events that are triggered will be counted here.
The next column is Conversions. Certain events can be marked as conversions. Conversions are the end actions we want users to take on the site. This could include signing up for a newsletter, purchasing products, viewing a video, etc. Any action critical for the business can be marked as a conversion event. Any eCommerce site will have a total revenue number as well. We don't have to have an eCommerce site for this revenue number to show up. We can even assign a value to the lead, such as users signing up for the newsletter.
They might be worth some money, and we can assign that value, and it'll show up in total revenue. So that is all about the User Acquisition; in addition to the User acquisition, we also have Traffic acquisition.
While User Acquisition focuses on users' acquisition the first time, a user is using the app or website. Traffic Acquisition focuses on sessions, so it's all new or repeat users. How are they coming to the website? We can see which source and medium are working for us, which ones earn, and how they're trending. Along with the bar chart, view of the source and medium.
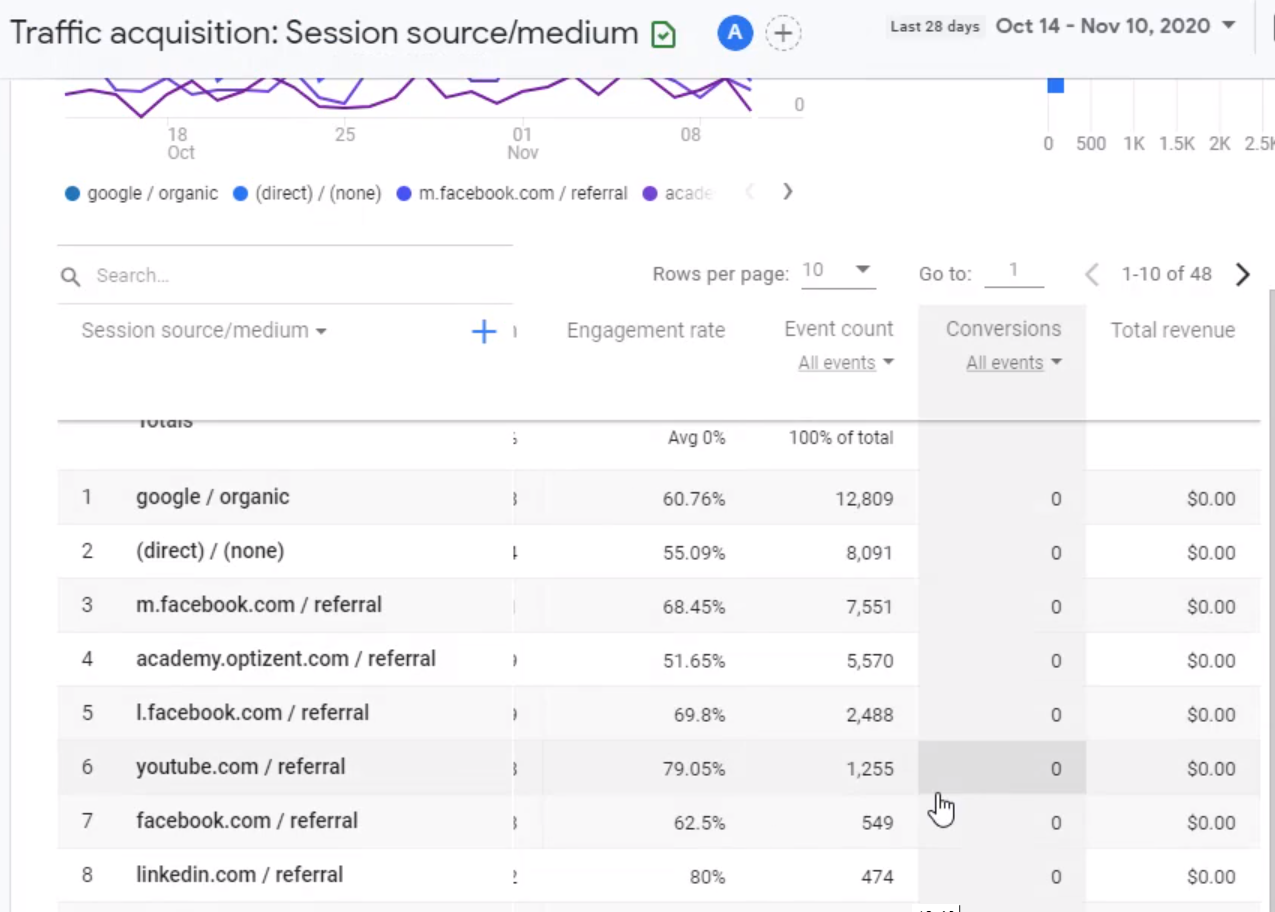
Next, we have a tabular format similar format we saw in the User Acquisition Report. Instead of focusing on new users, this one focuses on all user sessions, not just new user sessions.
Let's take a look at the metrics that are available here. It has users in this report. Then it has engaged sessions, average engagement time per session - How much on an average person is engaged on your site? Engaged session per user, events per session, engagement rate, event count, conversion, and total revenue are very similar to the User Acquisition Report, with a focus on sessions and all users instead of just new users.
Google Analytics 4 help and support
We are here to help you with all your Google Analytics needs. Our team can get you up and running in no time and also train you and your team to save you a lot of time so that you can focus on driving the business outcomes rather than configuring Google Analytics 4.
Online Course - If you want to learn on your own then check out Google Analytics 4 Masterclass
Workshop - We conduct the onsite customized workshop. Reach out to us for more details.
Consulting - Reach out to us for more details.