
As you might already know, GA4 does not provide a lot of pre-defined reports,
However, it does allow you to create custom reports to help you create the desired reports. GA4 reports come in two flavors, Overview Reports and Detailed Reports.
Detailed reports are the ones that we will tackle in this post as those are the ones that you will generally use.
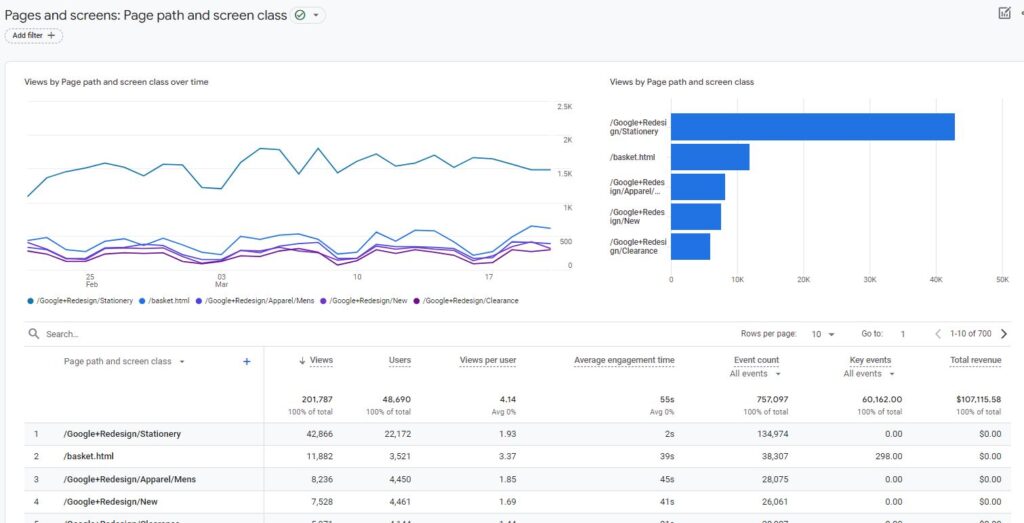
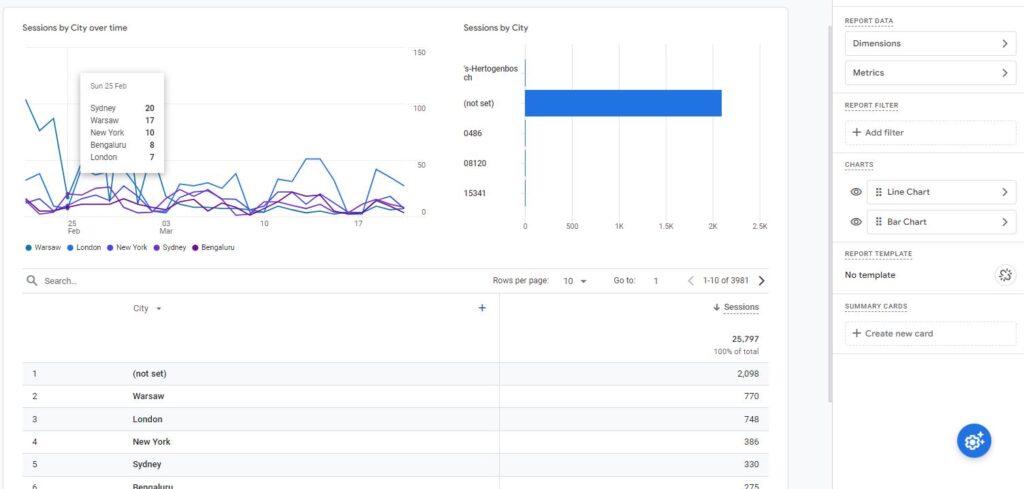
All GA4 detail reports have two charts in the top section, followed by the data in a tabular format, in the next section.
Following is an example of a GA4 detailed report that GA4 provides by default. The custom report that you will create in GA4 will also have the same look and feel.
To create a custom report, click the "Library" link at the bottom of the Reports menu.
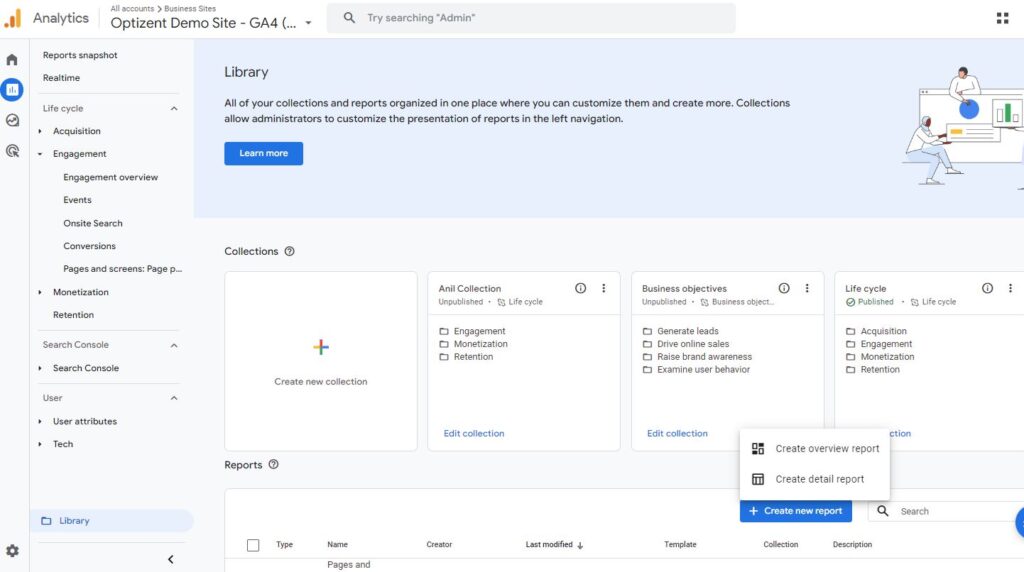
In the Library, click the "Create new report" button and pick "Create detail report" from the drop-down.
Now you will be taken to the screen where you can create a report from scratch or start by using one of the templates. I will show you how to create a report from scratch which will make it easier for you to work the templates if you desire to do so.
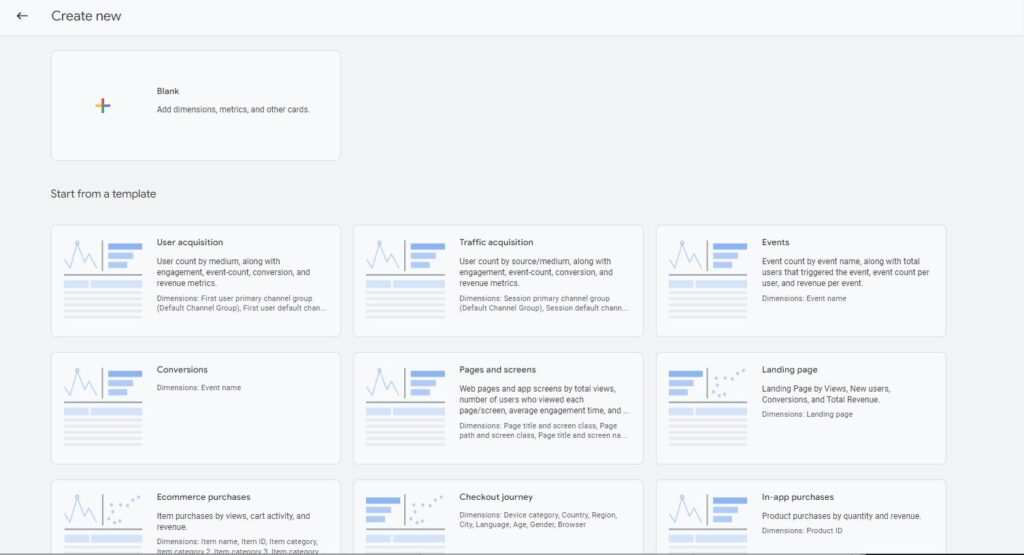
Click on Blank. Now it shows a blank template where we can create a report.
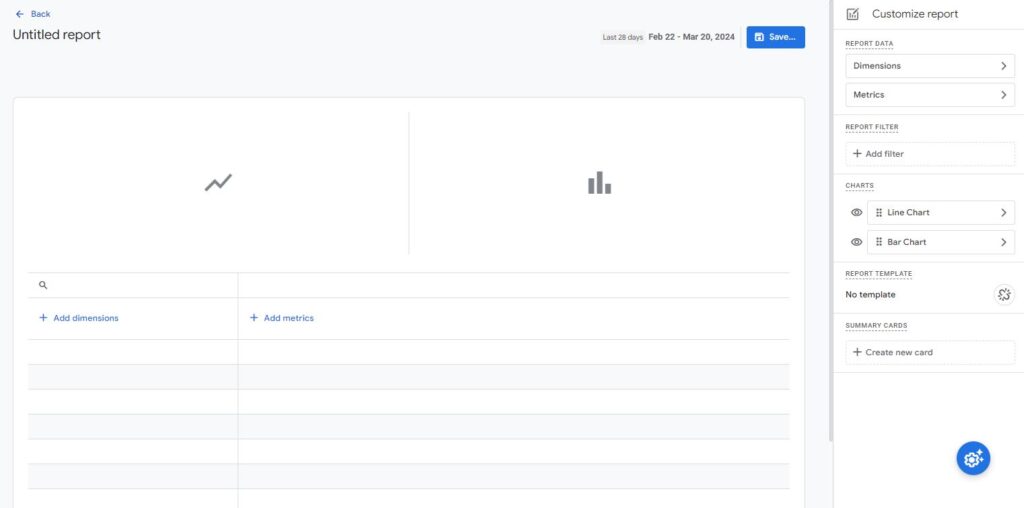
As mentioned before, there are two slots for the charts that you can use on the report and the tabular data view showing the dimensions and metrics.
In the right-hand panel, pick the Dimensions and then Metrics that you want in your report. To add dimensions, click "Add Dimensions" in the report area or in the right-hand panel. Both these options will open another panel where you can select the dimensions that you want to add to the reports. The first dimension you pick will become the default dimension which means it will be the dimension that will show up when a user goes to this report. However, you can add other dimensions as well. These dimensions will be available to you in a drop-down in the final report. After you are done, click on Apply.
Use the same process to pick the metrics for your report. You can only select up to 12 metrics.
Once you pick the dimensions and metrics GA4 will automatically create the two charts. These charts are based on the dimensions and metrics that were selected. The first metric that you select shows up right in the Scatter graph.
If you do not like the bar graph and the scattered chart, then you can change the chart type by going to the right-hand panel and picking a different chart type.
To change the chart type, click on the arrow on the chart option and pick a different chart type.
You can also hide one or both of these charts by clicking on the right-hand panel icons. Clicking on the eye icon next to the bar chart will hide the bar chart. Similarly, you can also remove the second chart by clicking on the icon next to it.
You can also create one or more summary cards. Summary cards highlight the key points in the detailed report. These summary cards are then used in an overview report. I will cover Overview reports in a future post.
Once done, go ahead and click on Save. Now the report is ready. Click on the back, and this report is now available for you to use in our own collections or existing collections. If you are not familiar with the collection then stay tuned, I will cover them in a future post.
Google Analytics 4 help and support
We are here to help you with all your Google Analytics needs. Our team can get you up and running in no time and also train you and your team to save you a lot of time so that you can focus on driving the business outcomes rather than configuring Google Analytics 4.
Online Course -Master GA4 with my comprehensive GA4 course on Optizent Academy
Workshop - We conduct the onsite customized workshop. Reach out to us for more details
Hire Us - We have helped several businesses implement and fix their GA4 issues. Are we the right agency for you? Contact us for no-obligation conversation.