
Analysis Hub is one of the most important features of Google Analytics 4 (GA4). It is a collection of advanced analysis techniques that help you uncover deeper insights into your customers' behavior and go beyond the standard reports to help you uncover deeper insights about your customers' behavior.
In the previous version of Google Analytics (aka Universal Analytics or as some call it GA3) you had several canned reports with limited capability to create reports and analysis using Custom Reports. In Google Analytics 4, you will find Analysis Hub, which is a much more powerful and feature-rich interface that helps you conduct deeper analysis as well as provide a way to create custom reports to meet the needs of your users.
Users of Universal Analytics keep complaining about missing reports but trust me, once you use the analysis hub and understand the flexibility it provides you will forget about canned reports.
What can you do in Analysis Hub?
- Quickly perform ad hoc queries using one of the various analysis techniques
- Apply various visualization styles to your analysis
- Easily switch between techniques to find the right insight and view
- Drill down into the data to find deeper insights
- Create segments and audiences to use in your analysis
- Use filters and segments to focus on the data that's most relevant to you
- Export the analysis data for use in other tools
- Share your analyses with other users
Analysis Techniques in Analysis
Exploration
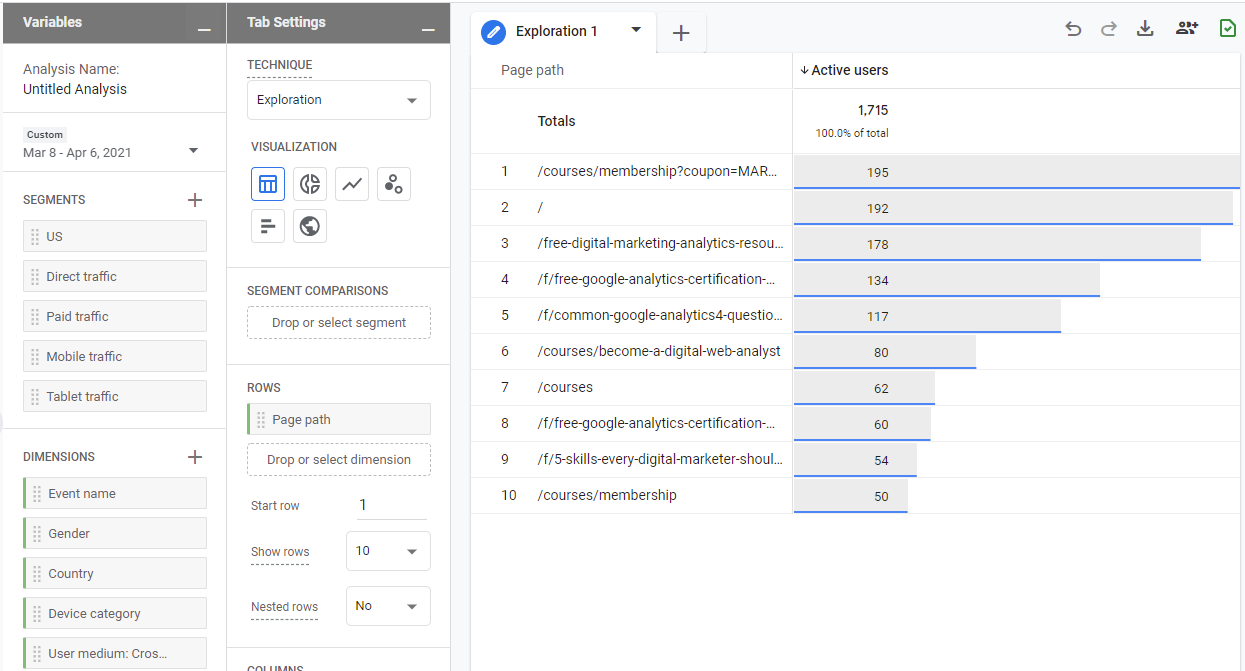
This is the most commonly used way of analyzing your data. It allows you to create a tabular view of your data using various Dimensions and Metrics.
Cohort analysis
Cohort means belong to the same group based on some common attributes. You can group your users based on common attributes e.g. acquisition date, and then analyze their behavior as a group and compares that to other cohorts.
Funnel analysis
Visualize the steps users take to complete tasks such as signup, purchase, etc. on your site or app
Segment overlap
Visually see how different user segments relate to each other. This can help you uncover new segments of users on your site.
User explorer
Allows you to get deeper insights into a group of users or individual users.
Path analysis
This technique allows you to visualize the paths your users take on your website or app.
How to Use Analysis Hub
- On the left Navigation menu, click on "Analysis"
- This will launch Analysis Hub, where you can see your past Analysis and create new Analysis
- There are several templates for you to use
- If you know which kind of technique will work then chose that from the template, if not then start with a blank template
I generally start with a blank template and then as I explore the data, I can figure out what template to use.
Creating Analysis in Analysis Hub
I will be updating this section with a video that will walk you through the process of creating analysis.
In nutshell, you have all your Dimensions, Metrics, Segments available in this interface. You select the required dimension and metrics from the left-hand selection pane to the right-hand side analysis interface. Pick the data, visualization style, and filter using Dimensions or Metrics. You can also select specific segments to dive deeper.
Other Google Analytics 4 posts that might like
- Google Analytics 4 (GA4) - Get Answers to Common Questions
- How To Exclude Internal Traffic in Google Analytics 4
- Bounce Rate in Google Analytics 4
- What is Google Analytics 4 (GA4)?
Where can I get help with Google Analytics 4?
We provide Google Analytics 4 consulting and training services. We can set up Google Analytics 4 as well as train your team to be self-sufficient. Contact us for a no-obligation consultation.