
This article will highlight the Active Users and Stickiness metrics. To see these metrics go to Engagement reports in Google Analytics 4. In Google Analytics, click on Engagement and then Overview. Scroll to see two charts, User Activity Over Time and User Stickiness.
First, let's take a look at one-day Active users. The trendline on the chart shows the daily count of users on the site or app. Hovering over any date will give you the count of users on that day. These users are also called active users in many scenarios, which will be discussed in the User Stickiness chart.
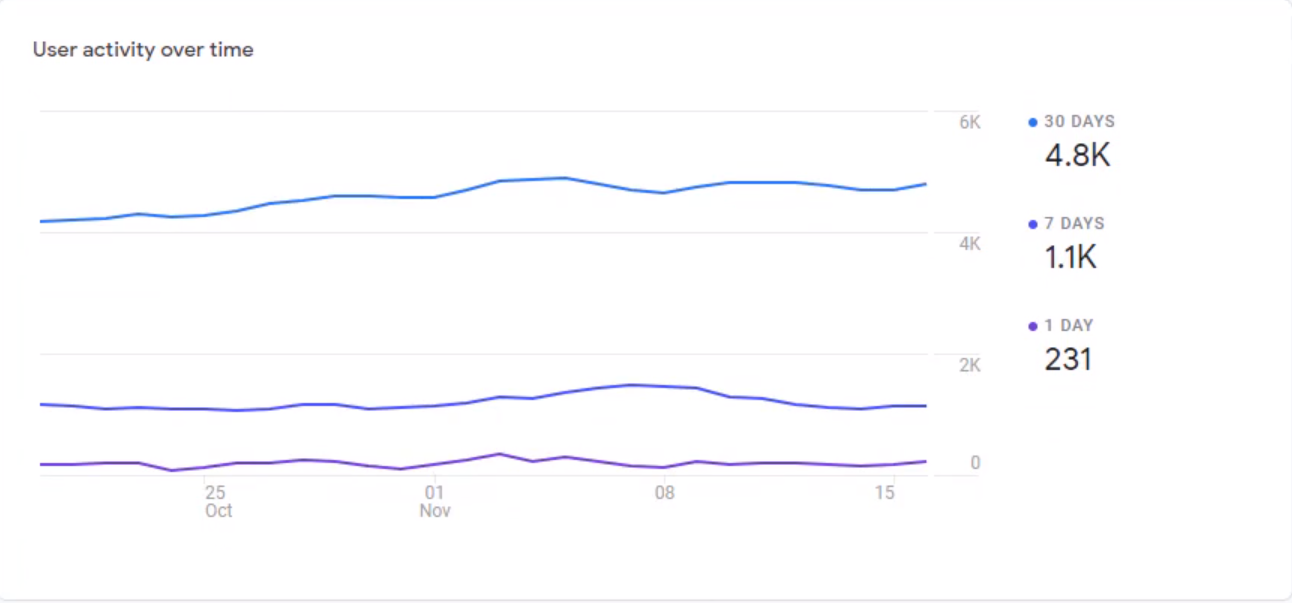
Active simply means the users who are active on the site or app on that day, which means the total number of users on the site or app. If you consistently spend the same amount of money on advertising every day, then the daily trend should be pretty stable. That's where most of the businesses are going to be. However, if you are in a hyper-growth mode, that means you're a startup spending a lot of money acquiring users, then you will see this trend going up.
If your trend breaks from the normal, whether it's stable or going up, that's when you need to start investigating to diagnose a problem. Suppose it goes down from the expected trend or goes up from the expected trend. The number below one day in the chart is the last day of your report. Next is the seven-day activity. Hovering over any point will provide users that arrived at your site within the last seven days of that date. So it goes back seven days from the date. It is the last seven days from that particular date. Similar to daily trends, look for peaks and valleys in this seven-day trend that will either tell you that something went wrong or something you have been doing right.
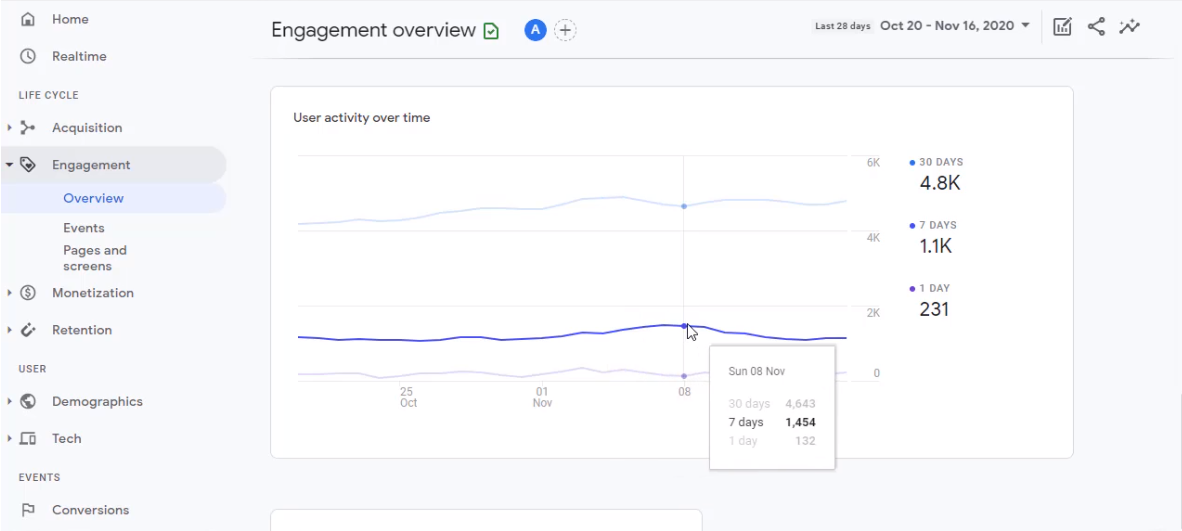
In the above image, you can see a slight uptick in these seven days compared to other seven-day periods. That means something was done in those seven days that led to this peak. Using this information, you can investigate further into daily activity and figure out the cause of this peak to leverage similar activities for future user engagement.
The third is the monthly view. It is 30-day active users or monthly active users. So hovering over any date will show you the active users in the past 30 days of that date. In an ideal situation, all the users acquired seven days ago or 30 days ago should be active every day. But that's not going to happen for most businesses unless you are a startup that venture capitalist funds. VCs generally use these numbers in ratios to figure out which company to invest in and how the companies they have invested in are engaging their users and bringing them back to the site or app.
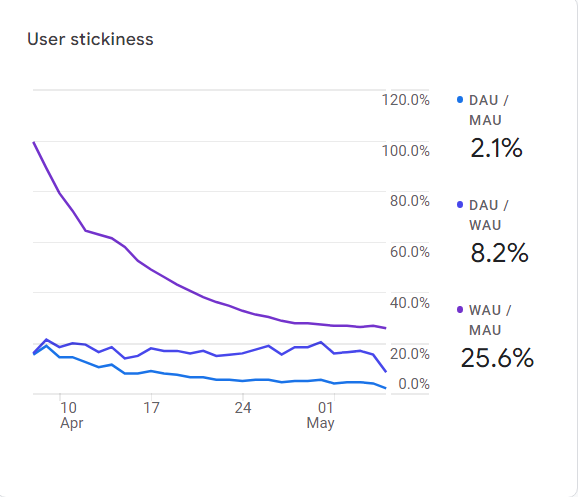
To do that, they use the three stickiness ratios that are shown in the chart. DAU, MAU, and WAU are the three stickiness factors that we looked at. Daily active users, monthly active users, and weekly active users. Using the ratio of these three metrics shows how sticky your app or website is. Let's take an example to see these numbers. Let's assume this is a brand new site or app, and you are acquiring 100 users per day.
In 30 days, you will have acquired 3000 users, 100 every day for 30 days. Now let's assume that your site or app is doing a great job engaging these users. It's very sticky, which means users come back every single day. Then on day 30th, you will have 3000 active users on the site or app. These are all the 3000 that you have acquired in the past 30 days.
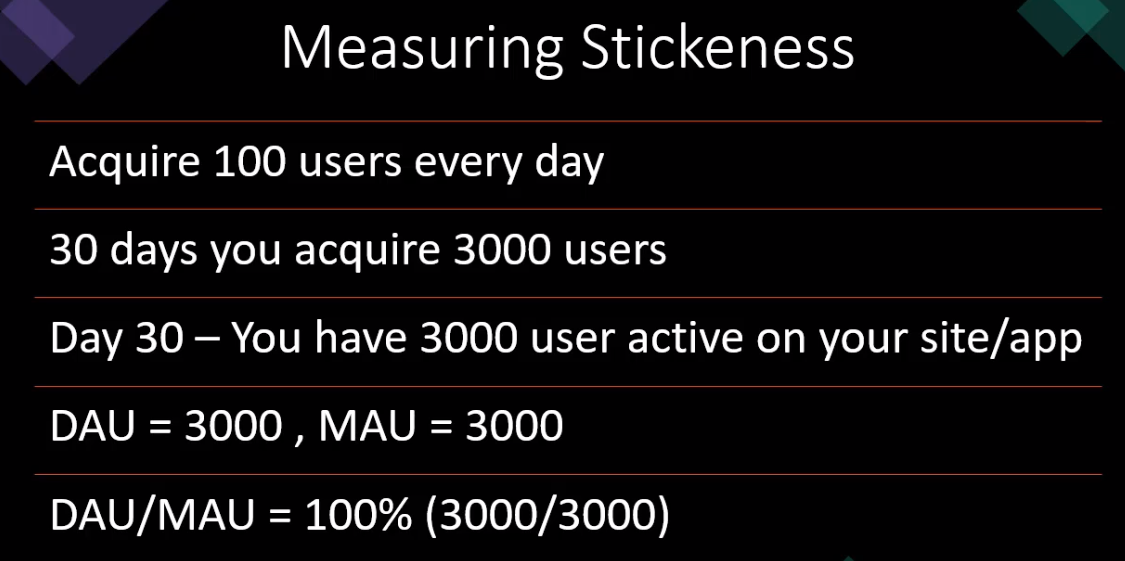
When you look at DAU, that's 3000. Similarly, your monthly active users are also going to be 3000. All the users that have come to the site. DAU and MAU ratio, in this case, will be 100% because it's a very sticky app or site that does a great job of bringing the users back. This is just a hypothetical situation because getting 100% of users to come back every day is next to impossible.
So DAU over MAU is not going to be 100 %. However, 20% is a good industry standard for an app or a site. Look at your own ratio, set it as a benchmark and then improve it from there. Every business is different unless you are a Facebook, Twitter, Instagram, etc. Do not expect users to come back every day. Think about what ratio makes sense for your business and try to achieve that.