
A custom funnel report in Google Analytics 4 is a report that allows you to track the steps that users take to complete a specific goal. For example, you could create a custom funnel report to track the steps that users take to purchase a product on your website.
Custom funnel reports are created using funnel exploration. A funnel exploration is a type of report that allows you to define the steps in a funnel and track the number of users who complete each step.
To create a custom funnel report, you first need to create a funnel exploration. You can do this by going to the Explore section of Google Analytics 4 and clicking on the Funnel Exploration template from the list of templates.
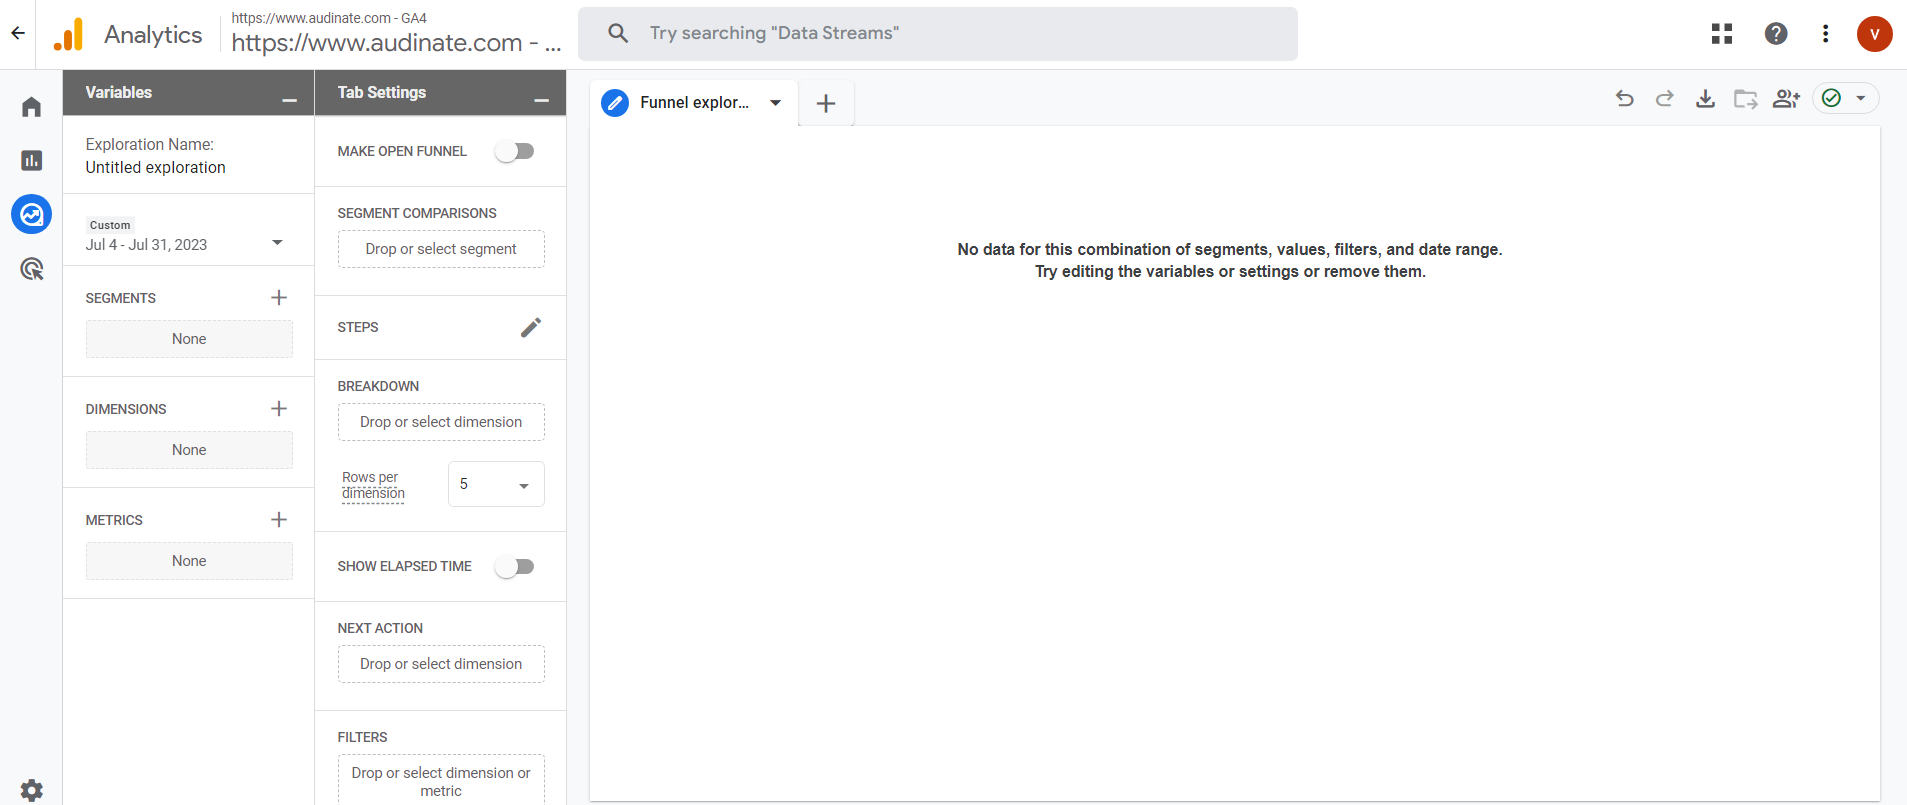
The exploration report interface is divided into three sections. The variables and the tab settings are on the left-hand side and the output or report is on the right-hand side.
- Variables.
- Tab settings.
- The Report.
Variables
The variables have segments, dimensions and metrics.
Tab Settings
The tab settings provide information about the technique used in the form. Visualization option (Standard or Trended funnel). An option to make an open funnel, segment comparisons, steps, breakdown, show elapsed time option, next action and filters.
Make Open Funnel
Funnels in Google Analytics 4 are initially set to a closed state, implying that any visitor who joins the funnel at the 2nd (or subsequent) step will not be included in the funnel count.
Segment Comparisons
In order to make segment comparisons, you are allowed to include a total of 4 segments that are already present in the Segments section of the Variables tab.
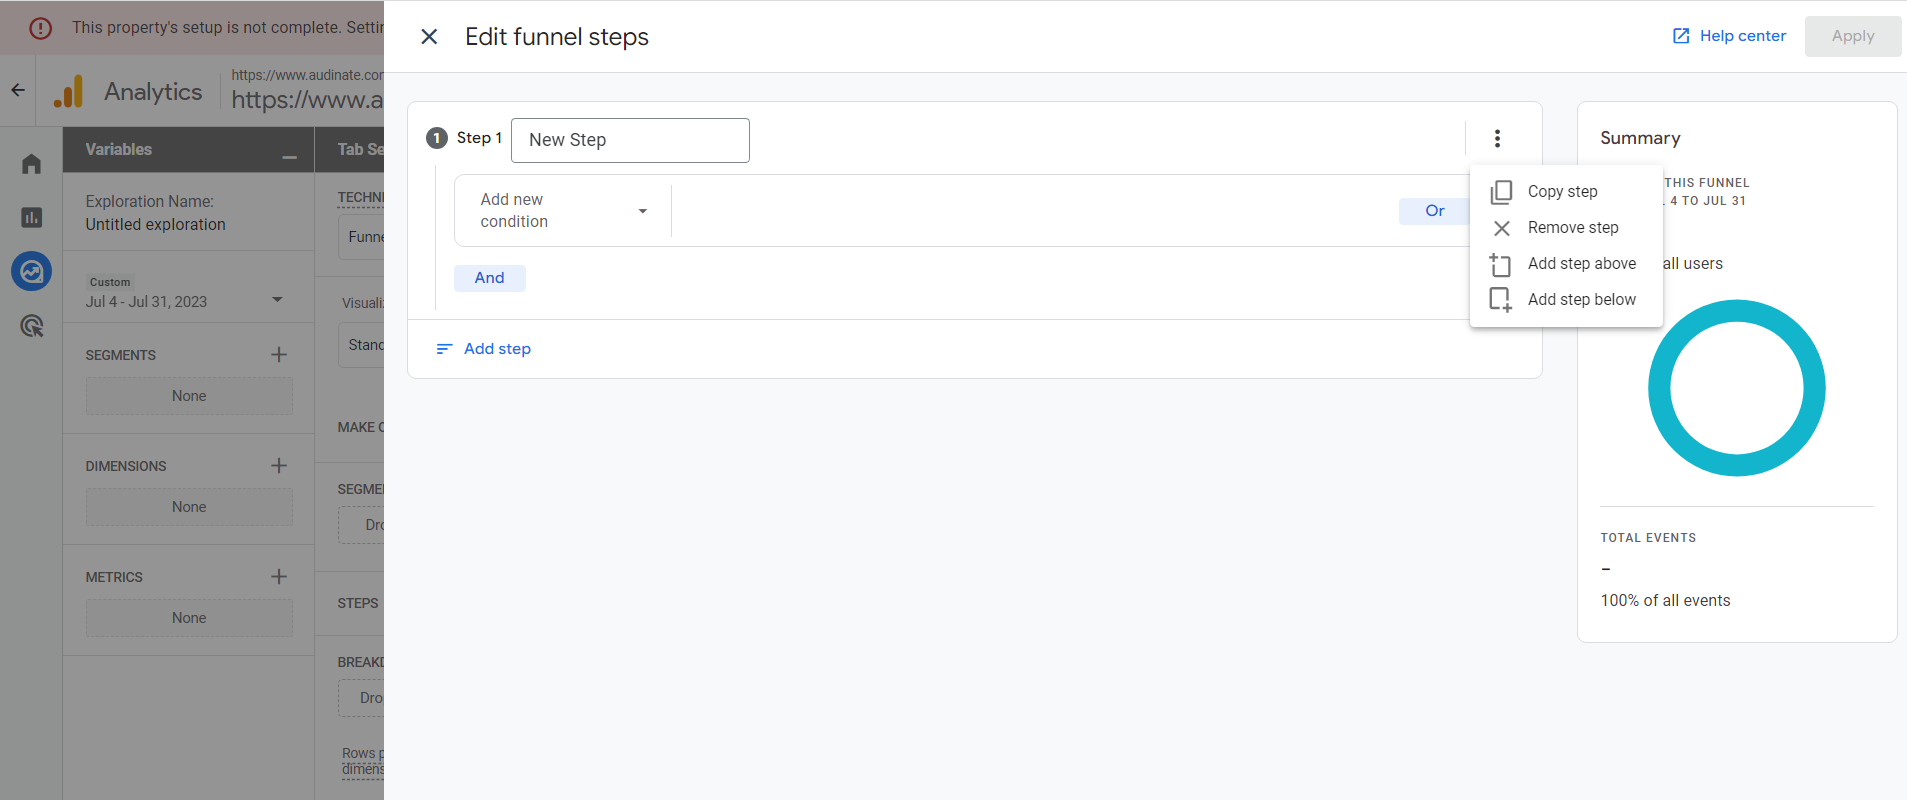
Steps
Once you have created a funnel exploration, you can define the steps in your funnel. You can use the STEPS pencil icon to add a new step. For each step, you need to specify the event that you want to track. You can also specify the conditions that must be met for the step to be considered a success.
Breakdown
In a custom funnel report in Google Analytics 4, the breakdown is a way to view the data in the report in different dimensions. For example, you could break down the data by device, country, or traffic source.
Show Elapsed Time
To determine the average time it takes for your users to progress from one step to another, activate the option to show elapsed time to display it.
Next Action
Interested in viewing additional events that a visitor takes in after a particular step? Enable the next action option and add the event name or screen name to it (currently it accepts these two only). A popup will appear displaying the next 5 most popular events that a visitor engaged after the particular step.
Filters
In a custom funnel report in Google Analytics 4, a filter is a way to exclude certain data from the report. For example, you could filter out data from a specific country or traffic source.
The Report
Once you have defined all of the steps in your funnel, you can create a funnel report. To do this, click Save and then apply. Your funnel report will be added to the Exploration section below the templates. You can view it by clicking the name of the report.
Custom funnel reports can be a valuable tool for understanding how users interact with your website or app. They can help you identify bottlenecks in your funnel and identify areas where you can improve the user experience.
Need help with GA4?
Contact us at support@optizent.com or fill out the form at the Contact Us page