
The Checkout journey report in GA4 is a predefined report that shows the data and visualization of the number and percentage of users who start the checkout process on your ecommerce website or app and complete each of the subsequent steps (add_shipping_info, add_payment_info, and purchase) in the checkout funnel.
The funnel in the Checkout journey report is a closed funnel, which means that it only includes those users who began at the first step (begin_checkout event). Any users who started the process at another step of the funnel say, add_payment_info, won't be included in this funnel. Currently, you can't customize the Checkout journey report.
Why Use Checkout Journey Report?
Issues and bottlenecks in the checkout process can break an eCommerce business. This report can help you identify those issues and bottlenecks in the checkout process in a timely fashion. For example, if you notice that a lot of users are dropping off at the add_shipping_info page and not proceeding to the next step, then you know that the issue lies on the shipping page, paying close attention to it, analyzing the various fields, and text, shipping cost, etc. can help you identify the issues.
Where is the Checkout Journey Report in GA4?
- Go to Your Google Analytics 4 property.
- Click on the reports in the left hand menu and go to "Reports"
- Under the reports, you will see one or both of the Monetization topic of the Life cycle collection or the Drive online sales topic of the Business objectives collection. The report is in both of these t
- Click on the report to open it.
If you don't see the report then you can add it to any collection by customizing the navigation. Check out this post, Google Analytics 4 Navigation and Customization
How it the Checkout Journey Report created?
This report shows you four steps of the checkout process and is based on the eCommerce Checkout Steps events implementation.
These events are:
- begin_checkout, which is the first step of checkout process
- add_shipping_info, which populates the Add shipping step
- add_payment_info, which populates the Add payment step
- purchase, which populates the Purchase step
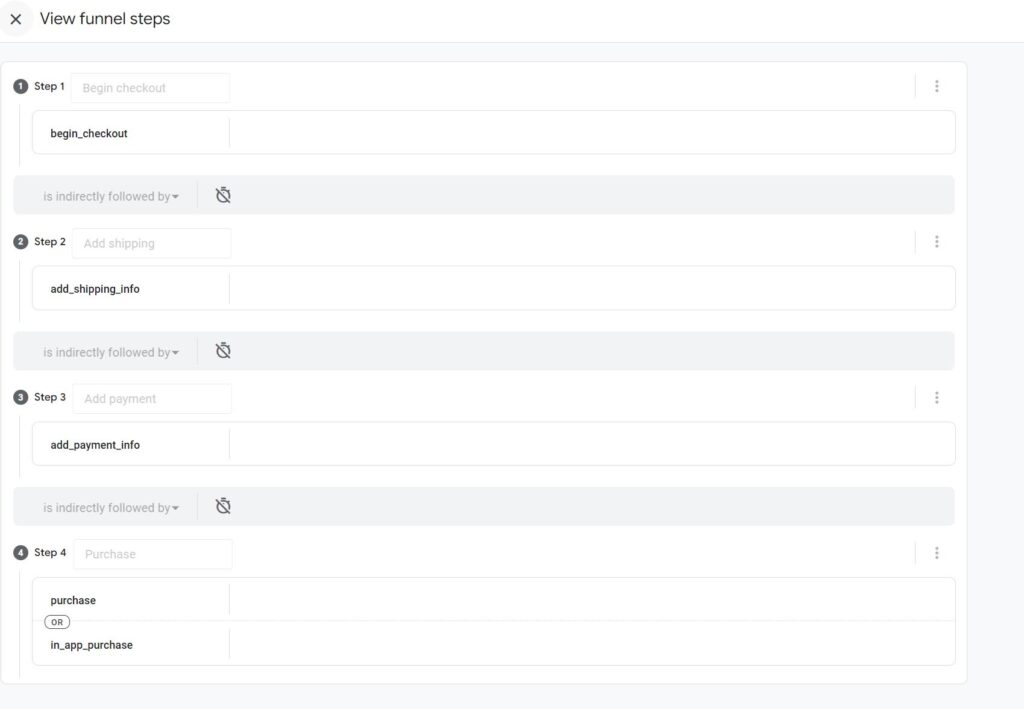
View the funnel steps
To see the steps that make up the funnel, click View funnel steps. This is a read-only view and as mentioned above, you can't change the steps or conditions of this report.
Understanding the Checkout Journey Report
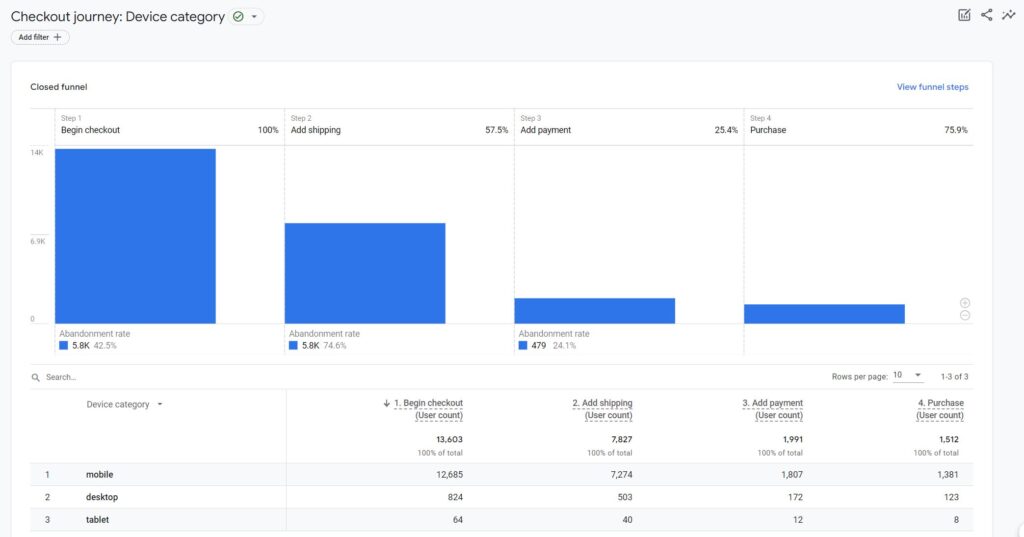
The Checkout journey report consists of a funnel chart and a table that helps you segment the data in the funnel by one dimension.
By default (see the image on top of this page), the report shows you the data by "Device Category" dimension. However, you can change the view and select one of the following dimensions by clicking on the drop-down arrow in the dimension column.
- Browser
- City
- Country
- Device Category (default)
- Language
- Region
How many users abandoned each step
The Abandonment rate shown below each step (except the last one) shows the percentage of users who abandoned the purchase path and did not continue to the next step of the funnel. These metrics can help you understand which steps are the bottlenecks in your checkout process.
The inverse of the abandonment rate is the retention rate. Retention rate refers to the percentage of users who came to the next step from the previous step. The header of the next step shows the retention rate. You can see the number of users who completed the current step by hovering over the bar chart in this report.
Other GA4 eCommerce Posts that you might be interested in
- Google Analytics 4 Ecommerce Events Introduction
- GA4 eCommerce Event tracking | Google Analytics 4
- Google Analytics 4 eCommerce View Item Event Tracking
GA4 eCommerce Complete Course
If you are interested in learning GA4 eCommerce Tracking and Reports then check out this course, https://academy.optizent.com/courses/ga4-zero-to-hero-complete-google-analytics-4-course